In technical work and software development, design is always tied to documentation and specifications. Perhaps the most important part is the diagrams. They help us describe design specifications precisely and concisely, and help the whole team "speak the same language."
Years ago, drawing diagrams was difficult, involved a lot of alignment, and could take a great deal of time. In addition, for projects with high requirements, we had to draw according to some standard, and the "industry standard" was UML.
UML is a "language" for drawing technical diagrams in software development. It is very clear and explicit, and can draw every possible technical specification of a piece of software.
But it is complicated.
I have just discovered an agent skill called "Diagram Design," which helps us draw technical diagrams quickly and save time. This skill can be integrated with many different agents.
In this article, we will try to learn how to use it.
Example: a classroom attendance app
I use a web app called ClassRoll. A teacher chooses a class and lesson session, then opens a seating chart. Each occupied seat shows a student's name. As the teacher calls the roll, they click Present or Absent on that student's seat. The status changes on the chart and is saved for the session. A mistaken click can be corrected.
This gives me a user interface, application logic, and data to draw. I will look at the system's components, one attendance action, and the relationships among classes, students, seats, lesson sessions, and attendance records.
Add Diagram Design to Codex
In this article, we will integrate Diagram Design into Codex.
I followed the project's instructions:
codex plugin marketplace add cathrynlavery/diagram-design
codex plugin add diagram-design@diagram-design
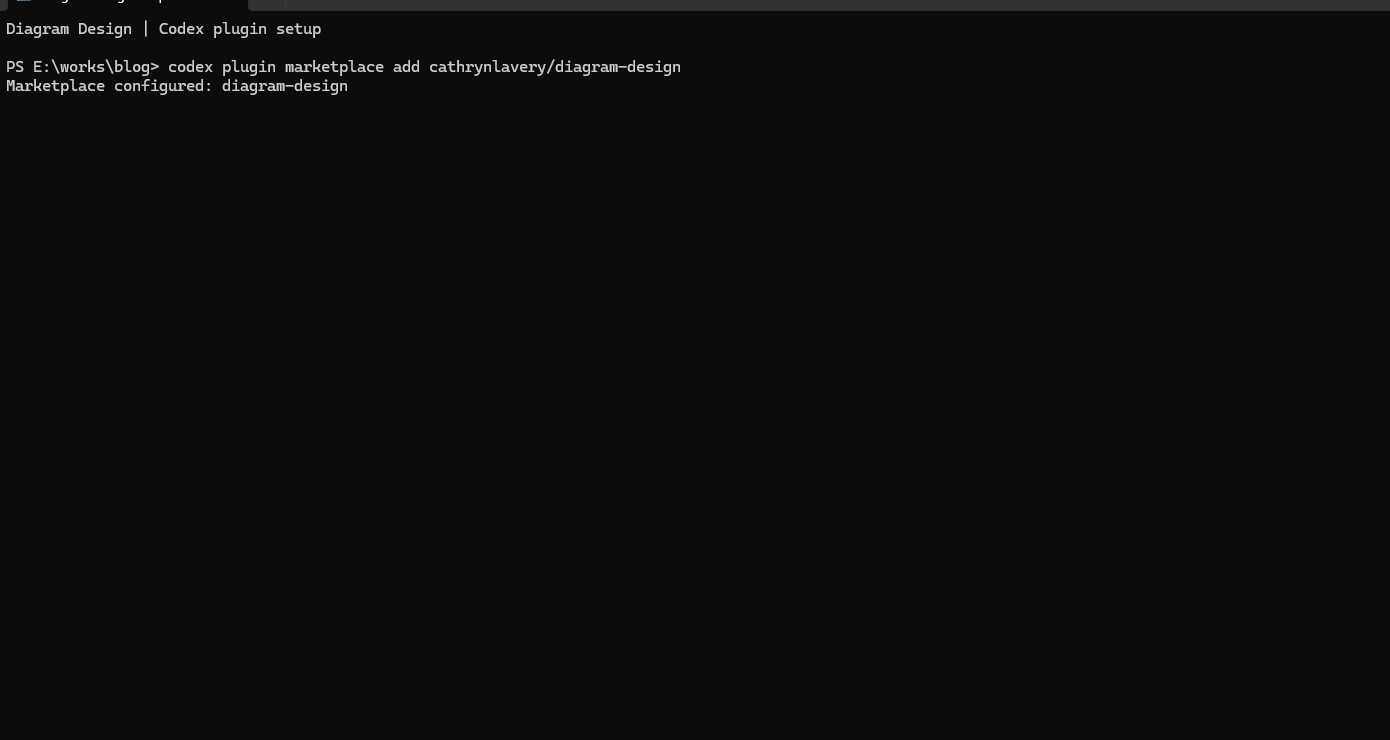
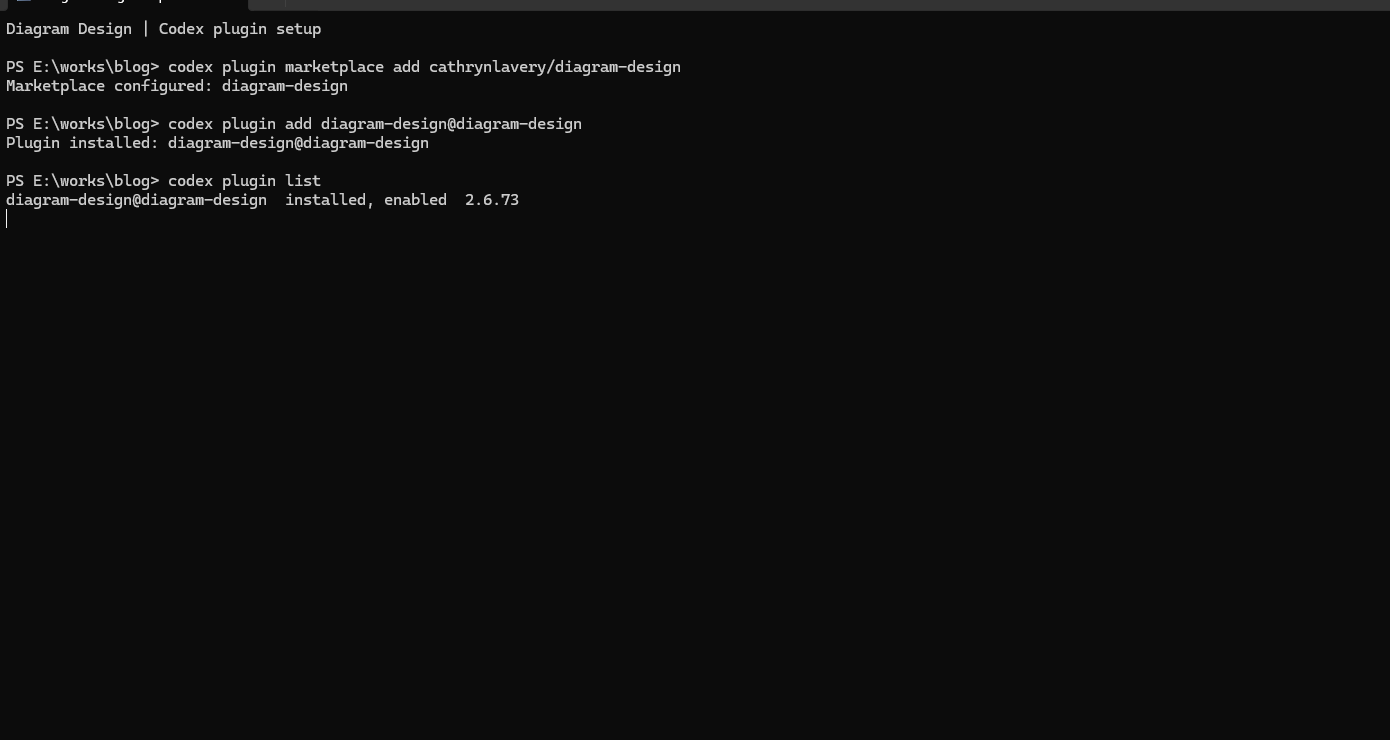
After installation, I opened a new Codex chat and named Diagram Design in the request. I worked through the design in that chat: describe the app, inspect the images, then ask for corrections where the first render was wrong.
Designing diagrams for ClassRoll
As mentioned above, UML is the "standard language" of technical diagrams in software development. I will try to create diagrams according to that standard. However, these days I also see people moving beyond the limits of UML, so I will create a "non-UML" version of each diagram as well.
I started the chat with this request (shortened here):
Use Diagram Design to design ClassRoll as three pairs of diagrams: UML component and three-tier architecture; UML sequence and a flowchart for marking attendance; UML class and ER for the data model. Export each diagram as self-contained HTML and a PNG. Use only the classroom seating-chart attendance example.
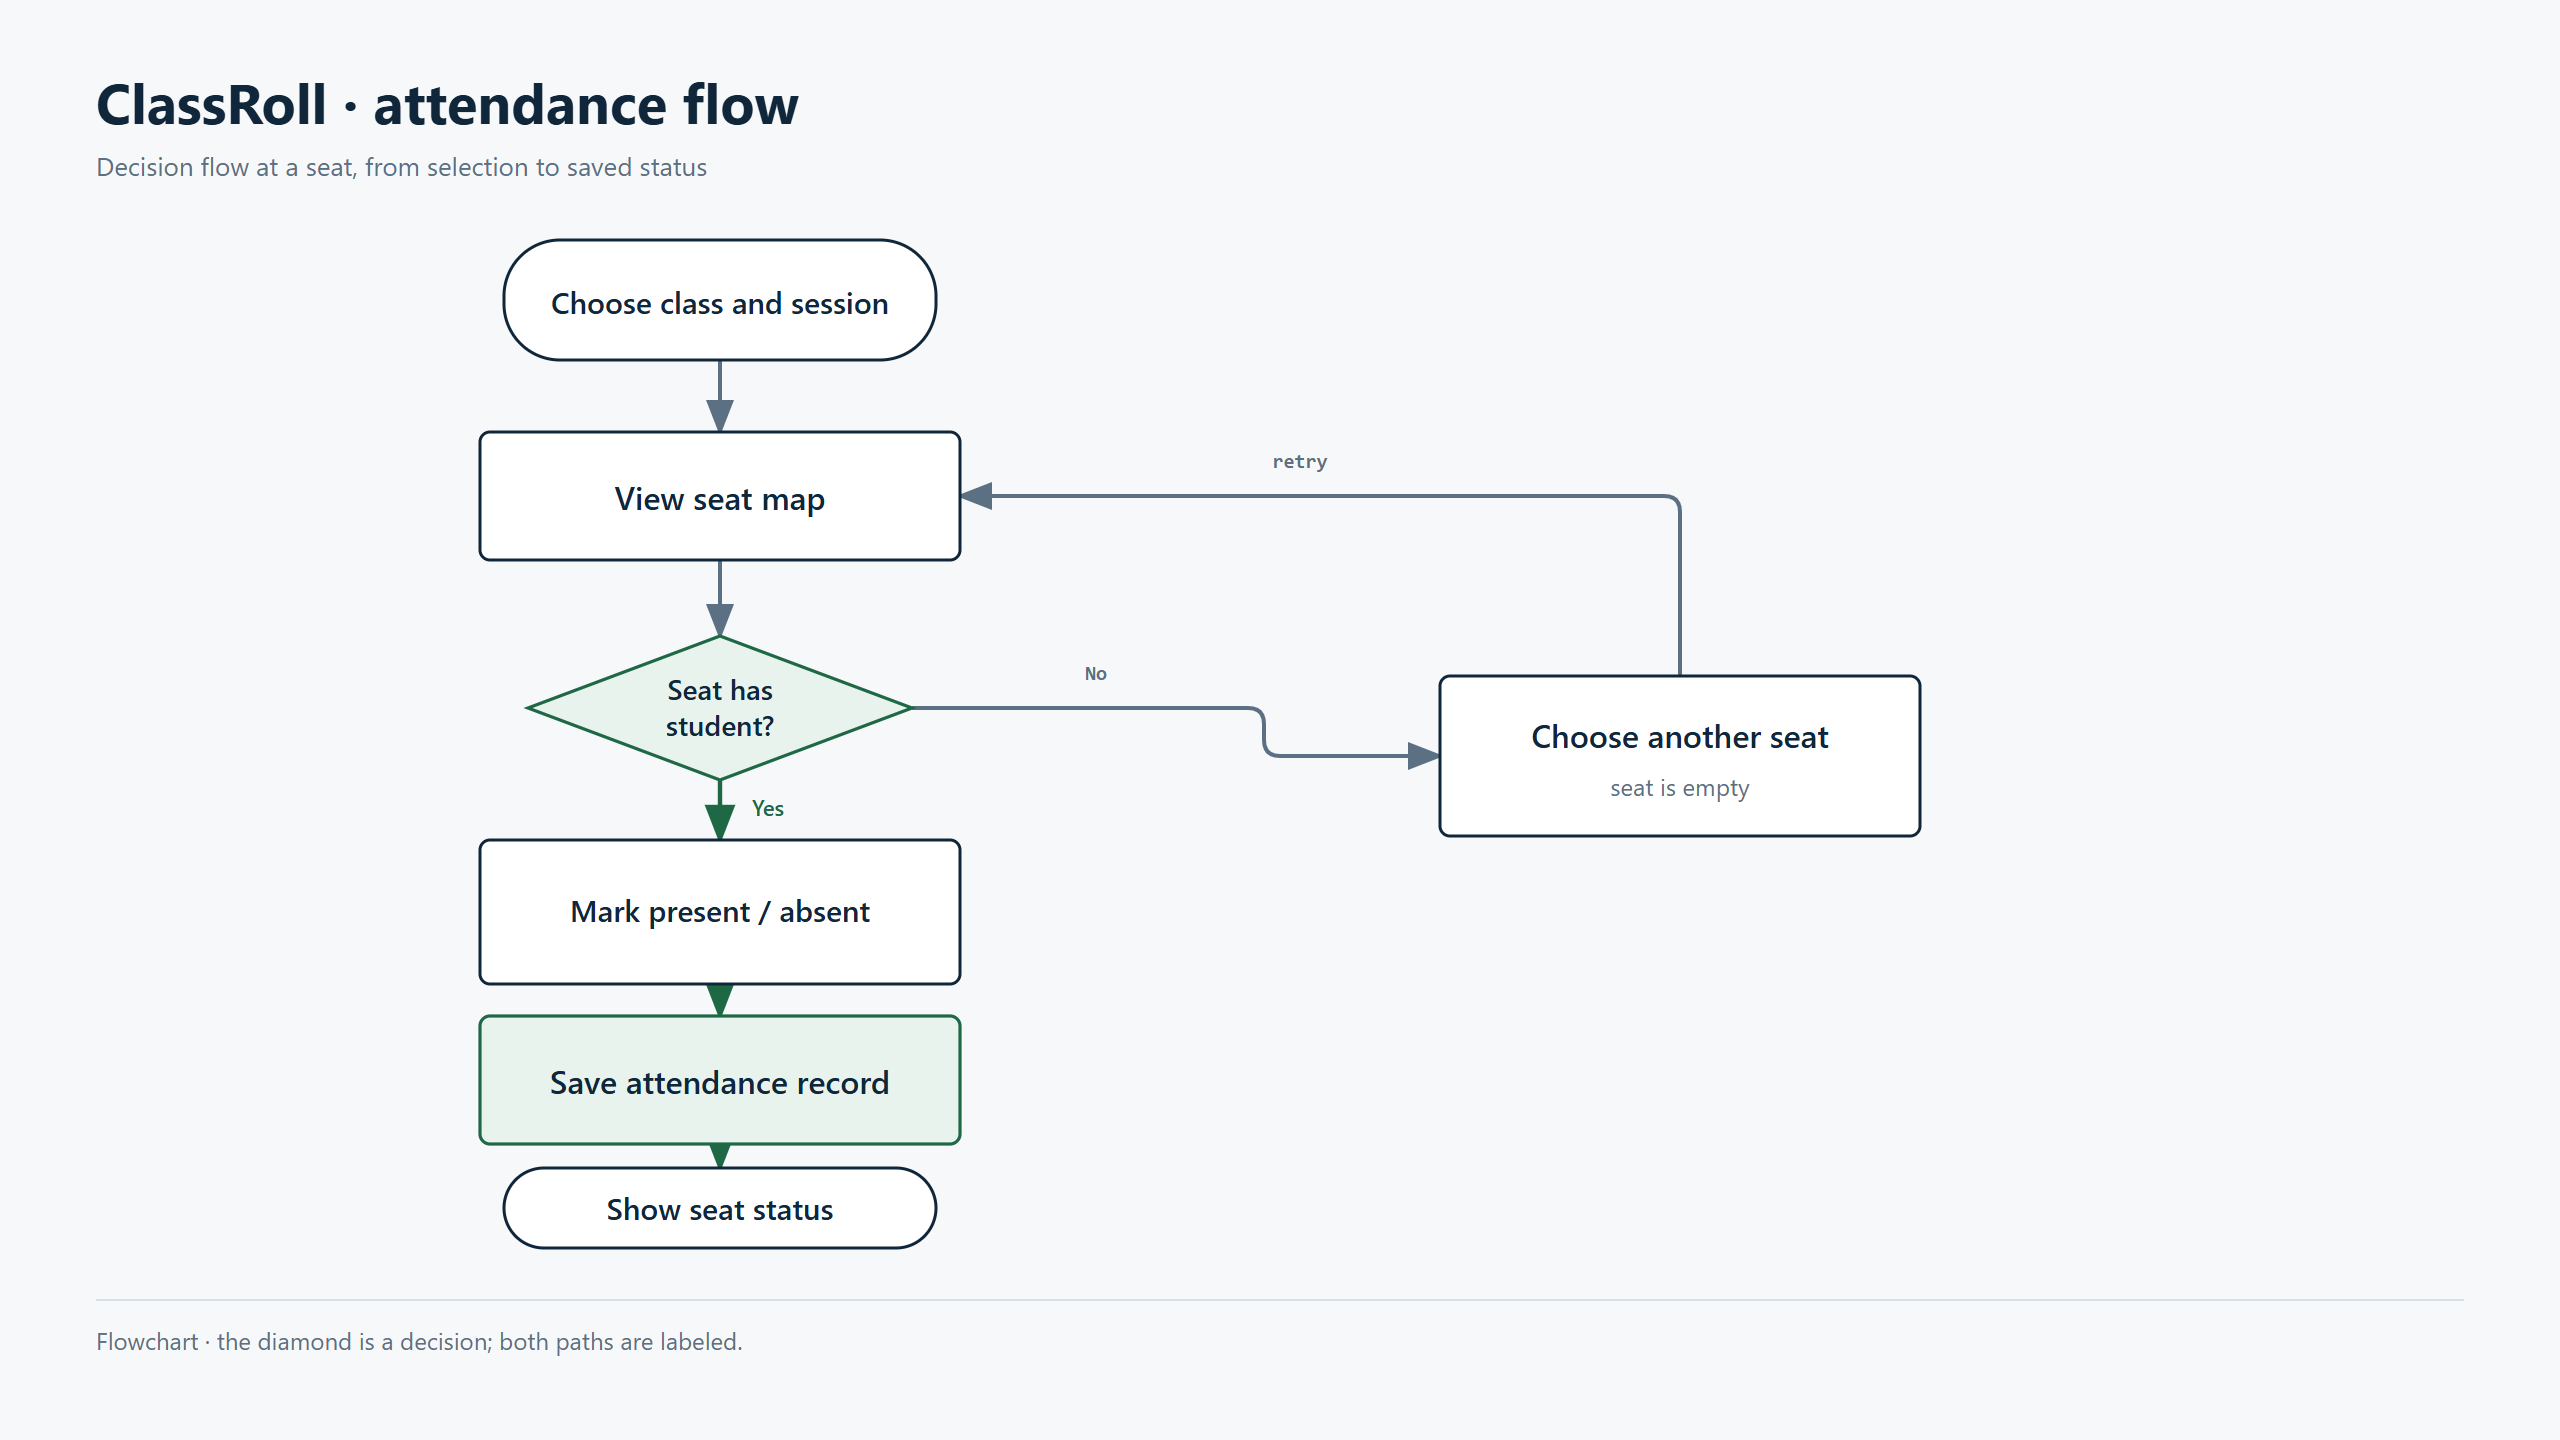
After seeing the images, I asked Codex to fix the “empty seat” branch of the flowchart because it initially left the wrong box.
Components and three tiers
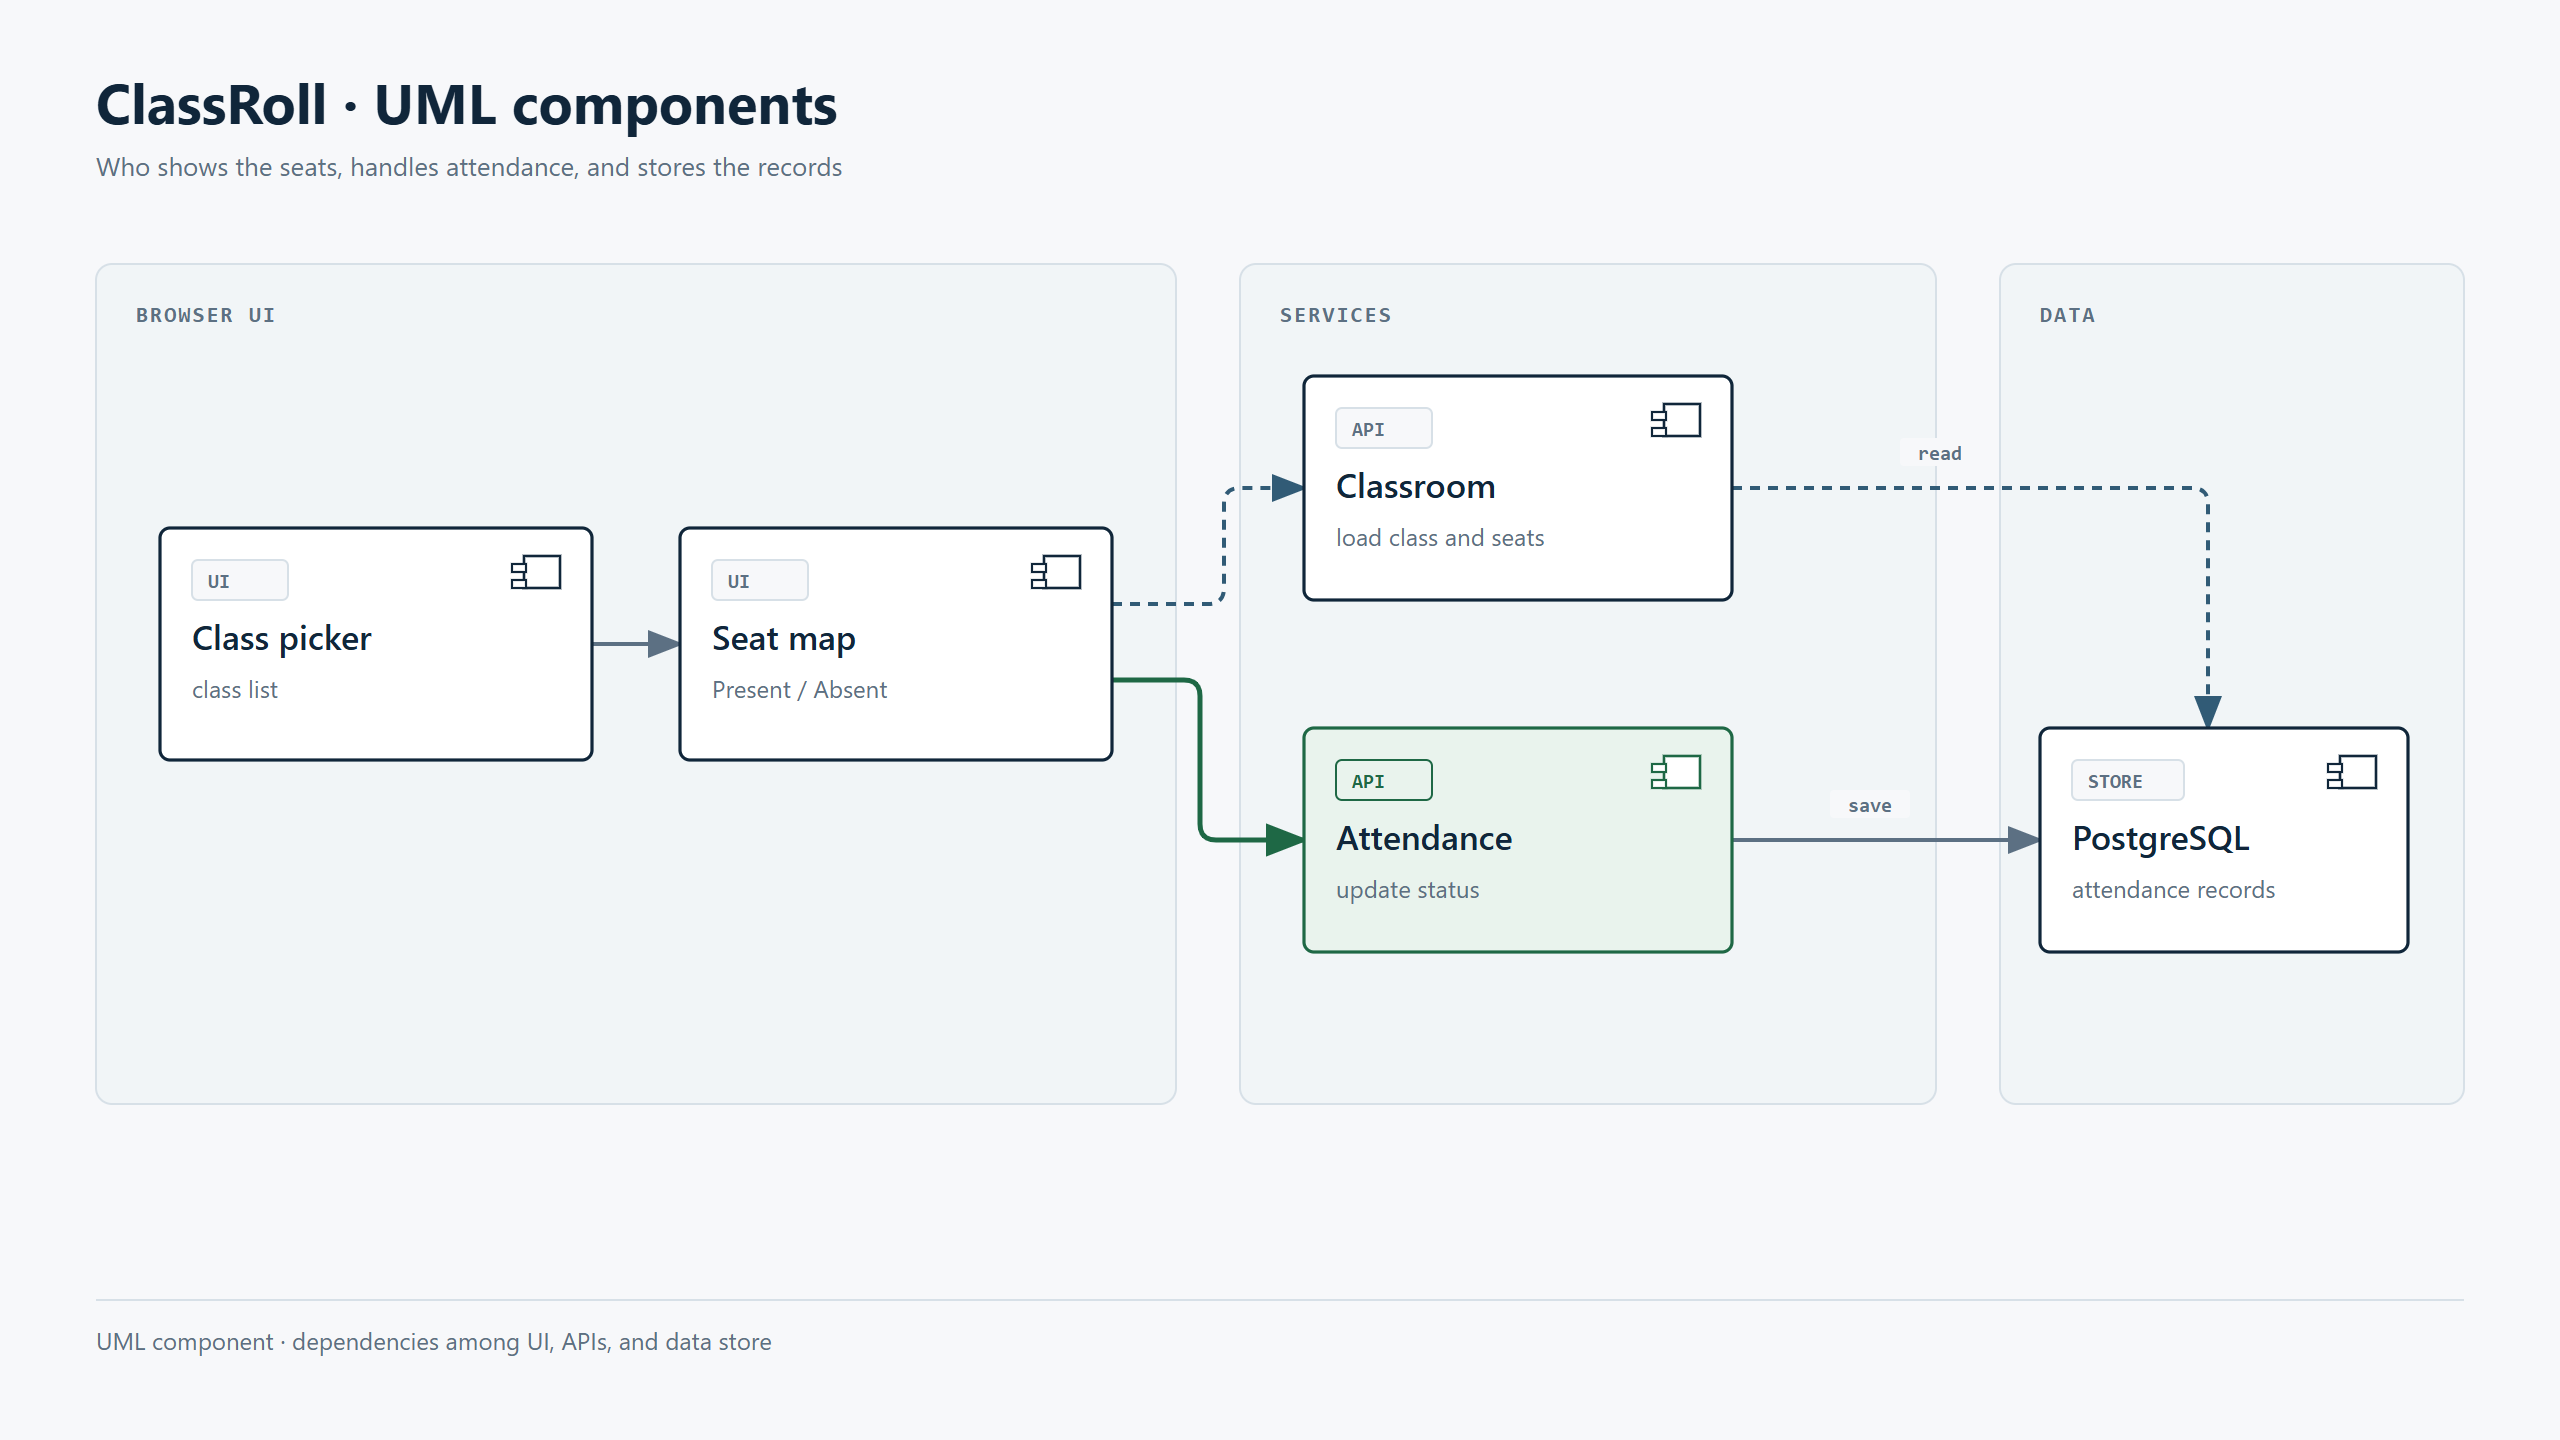
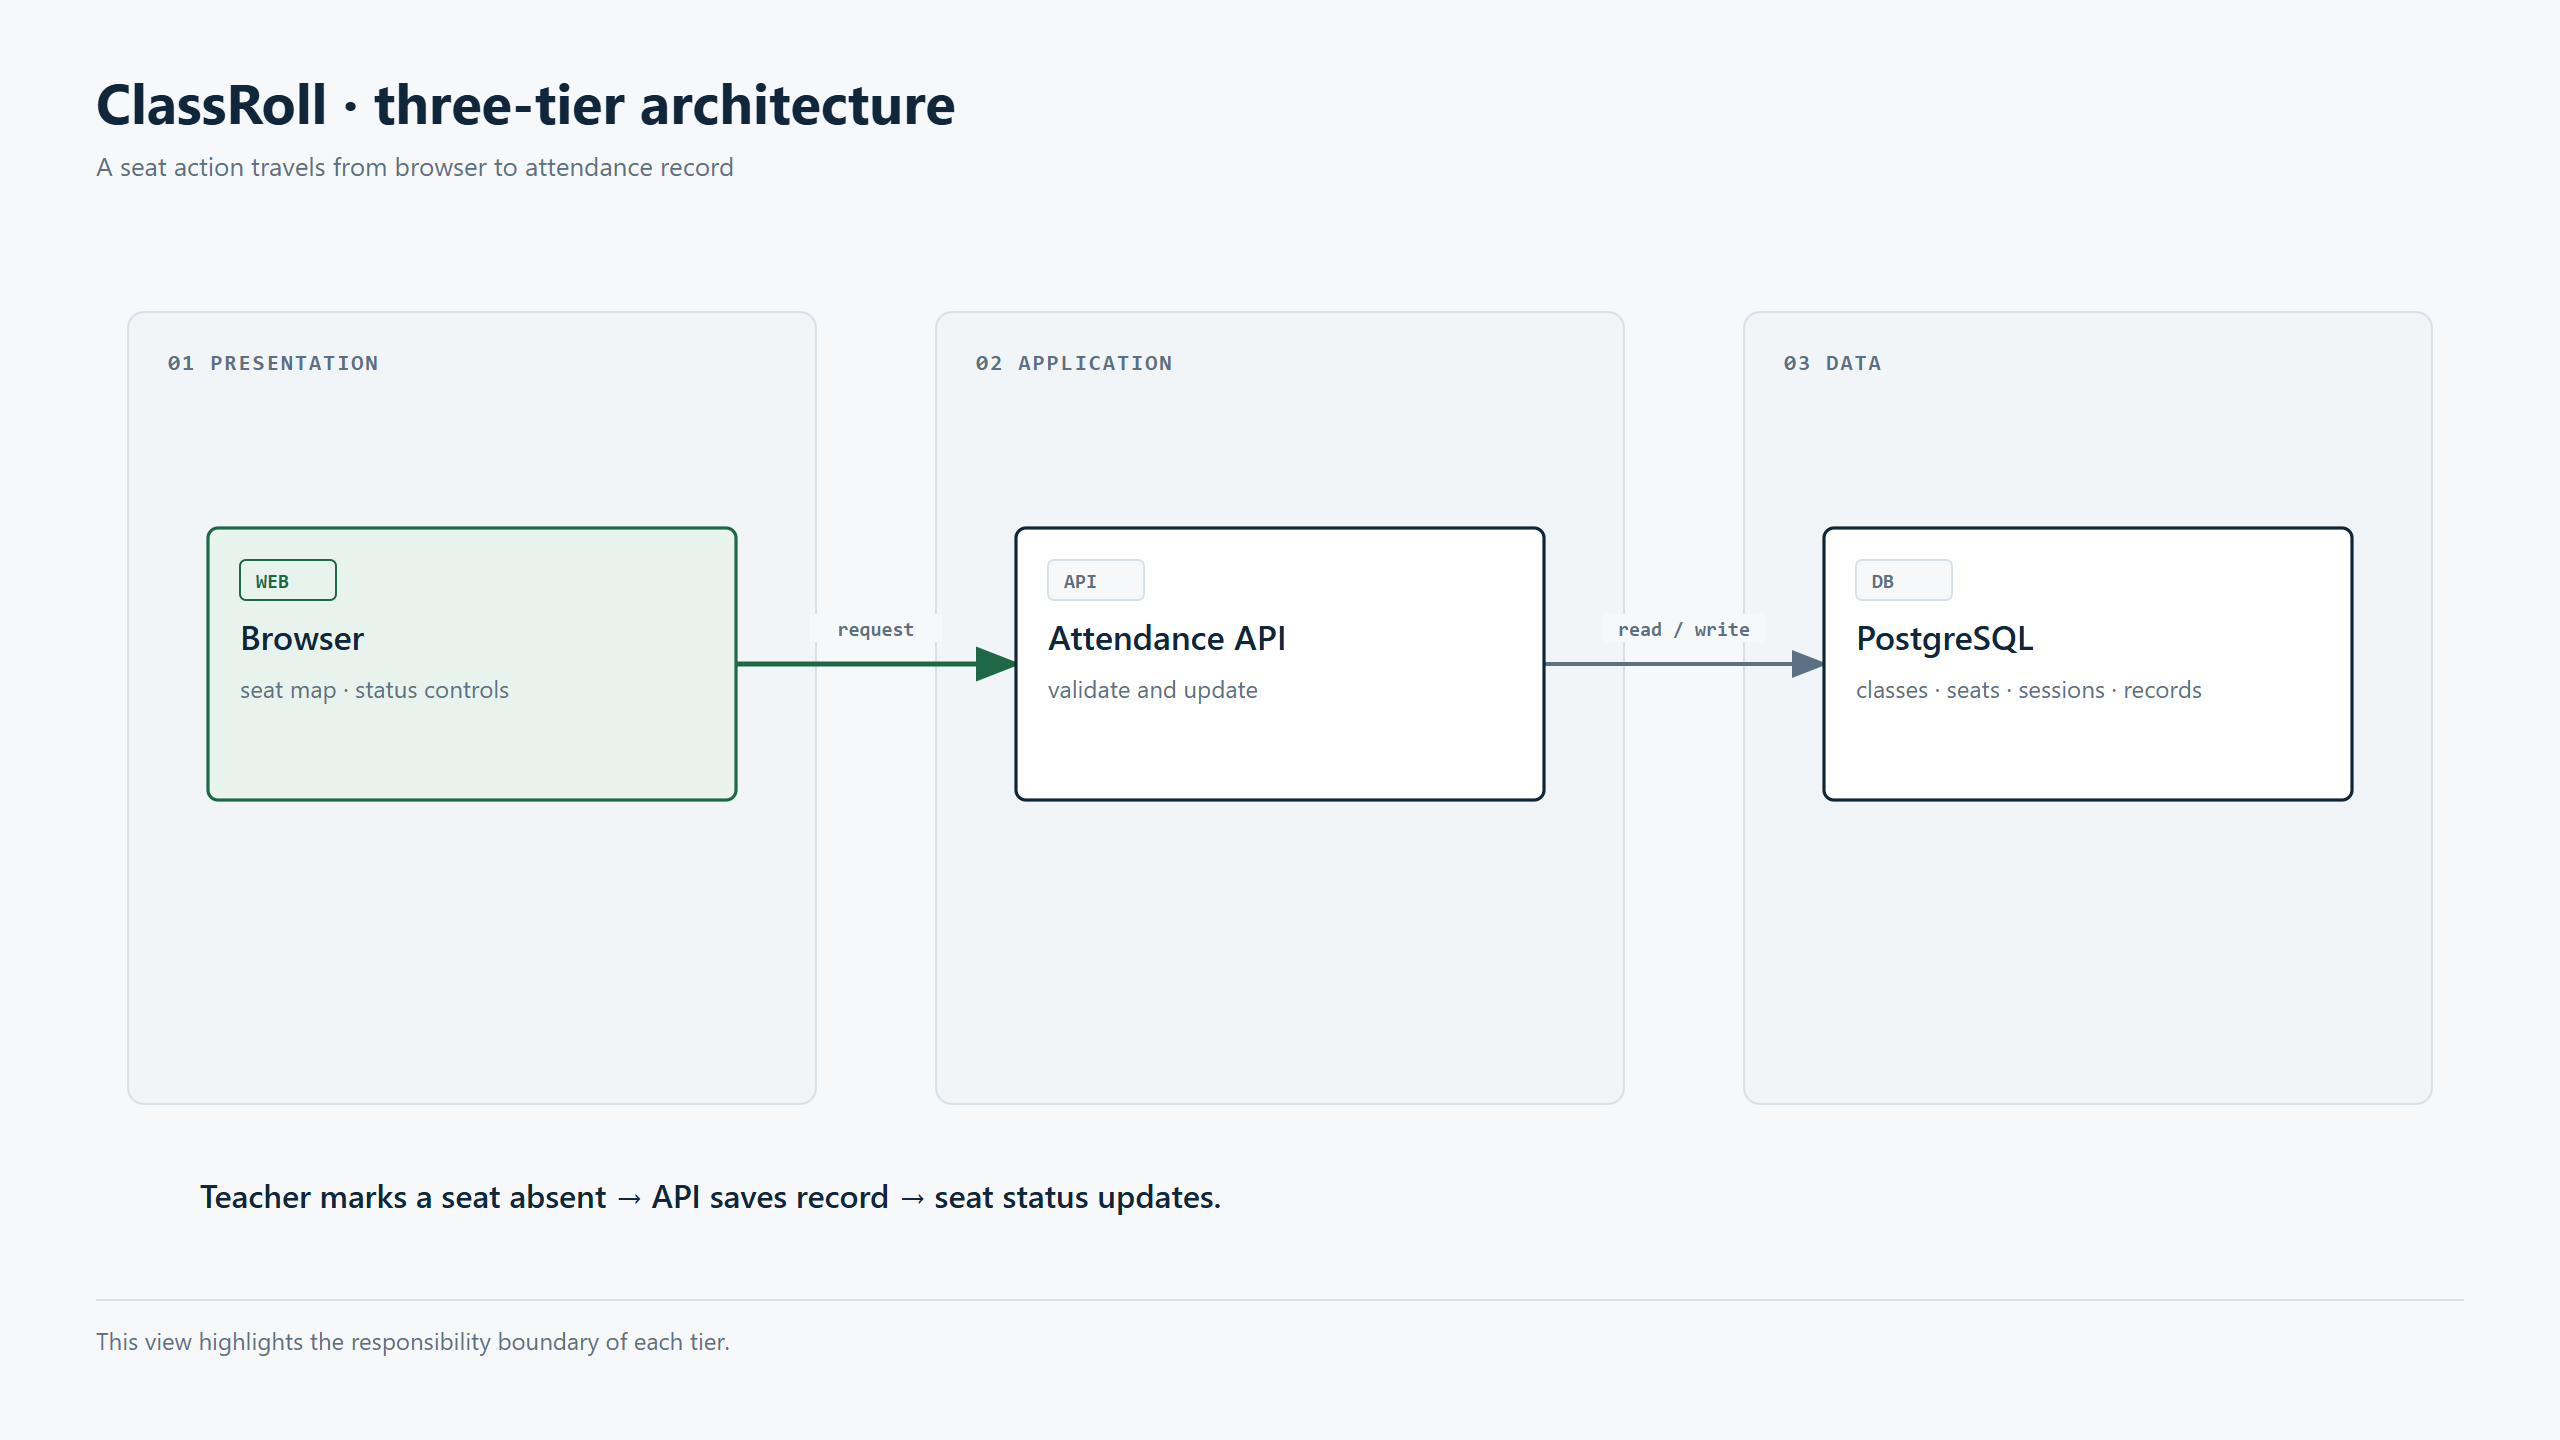
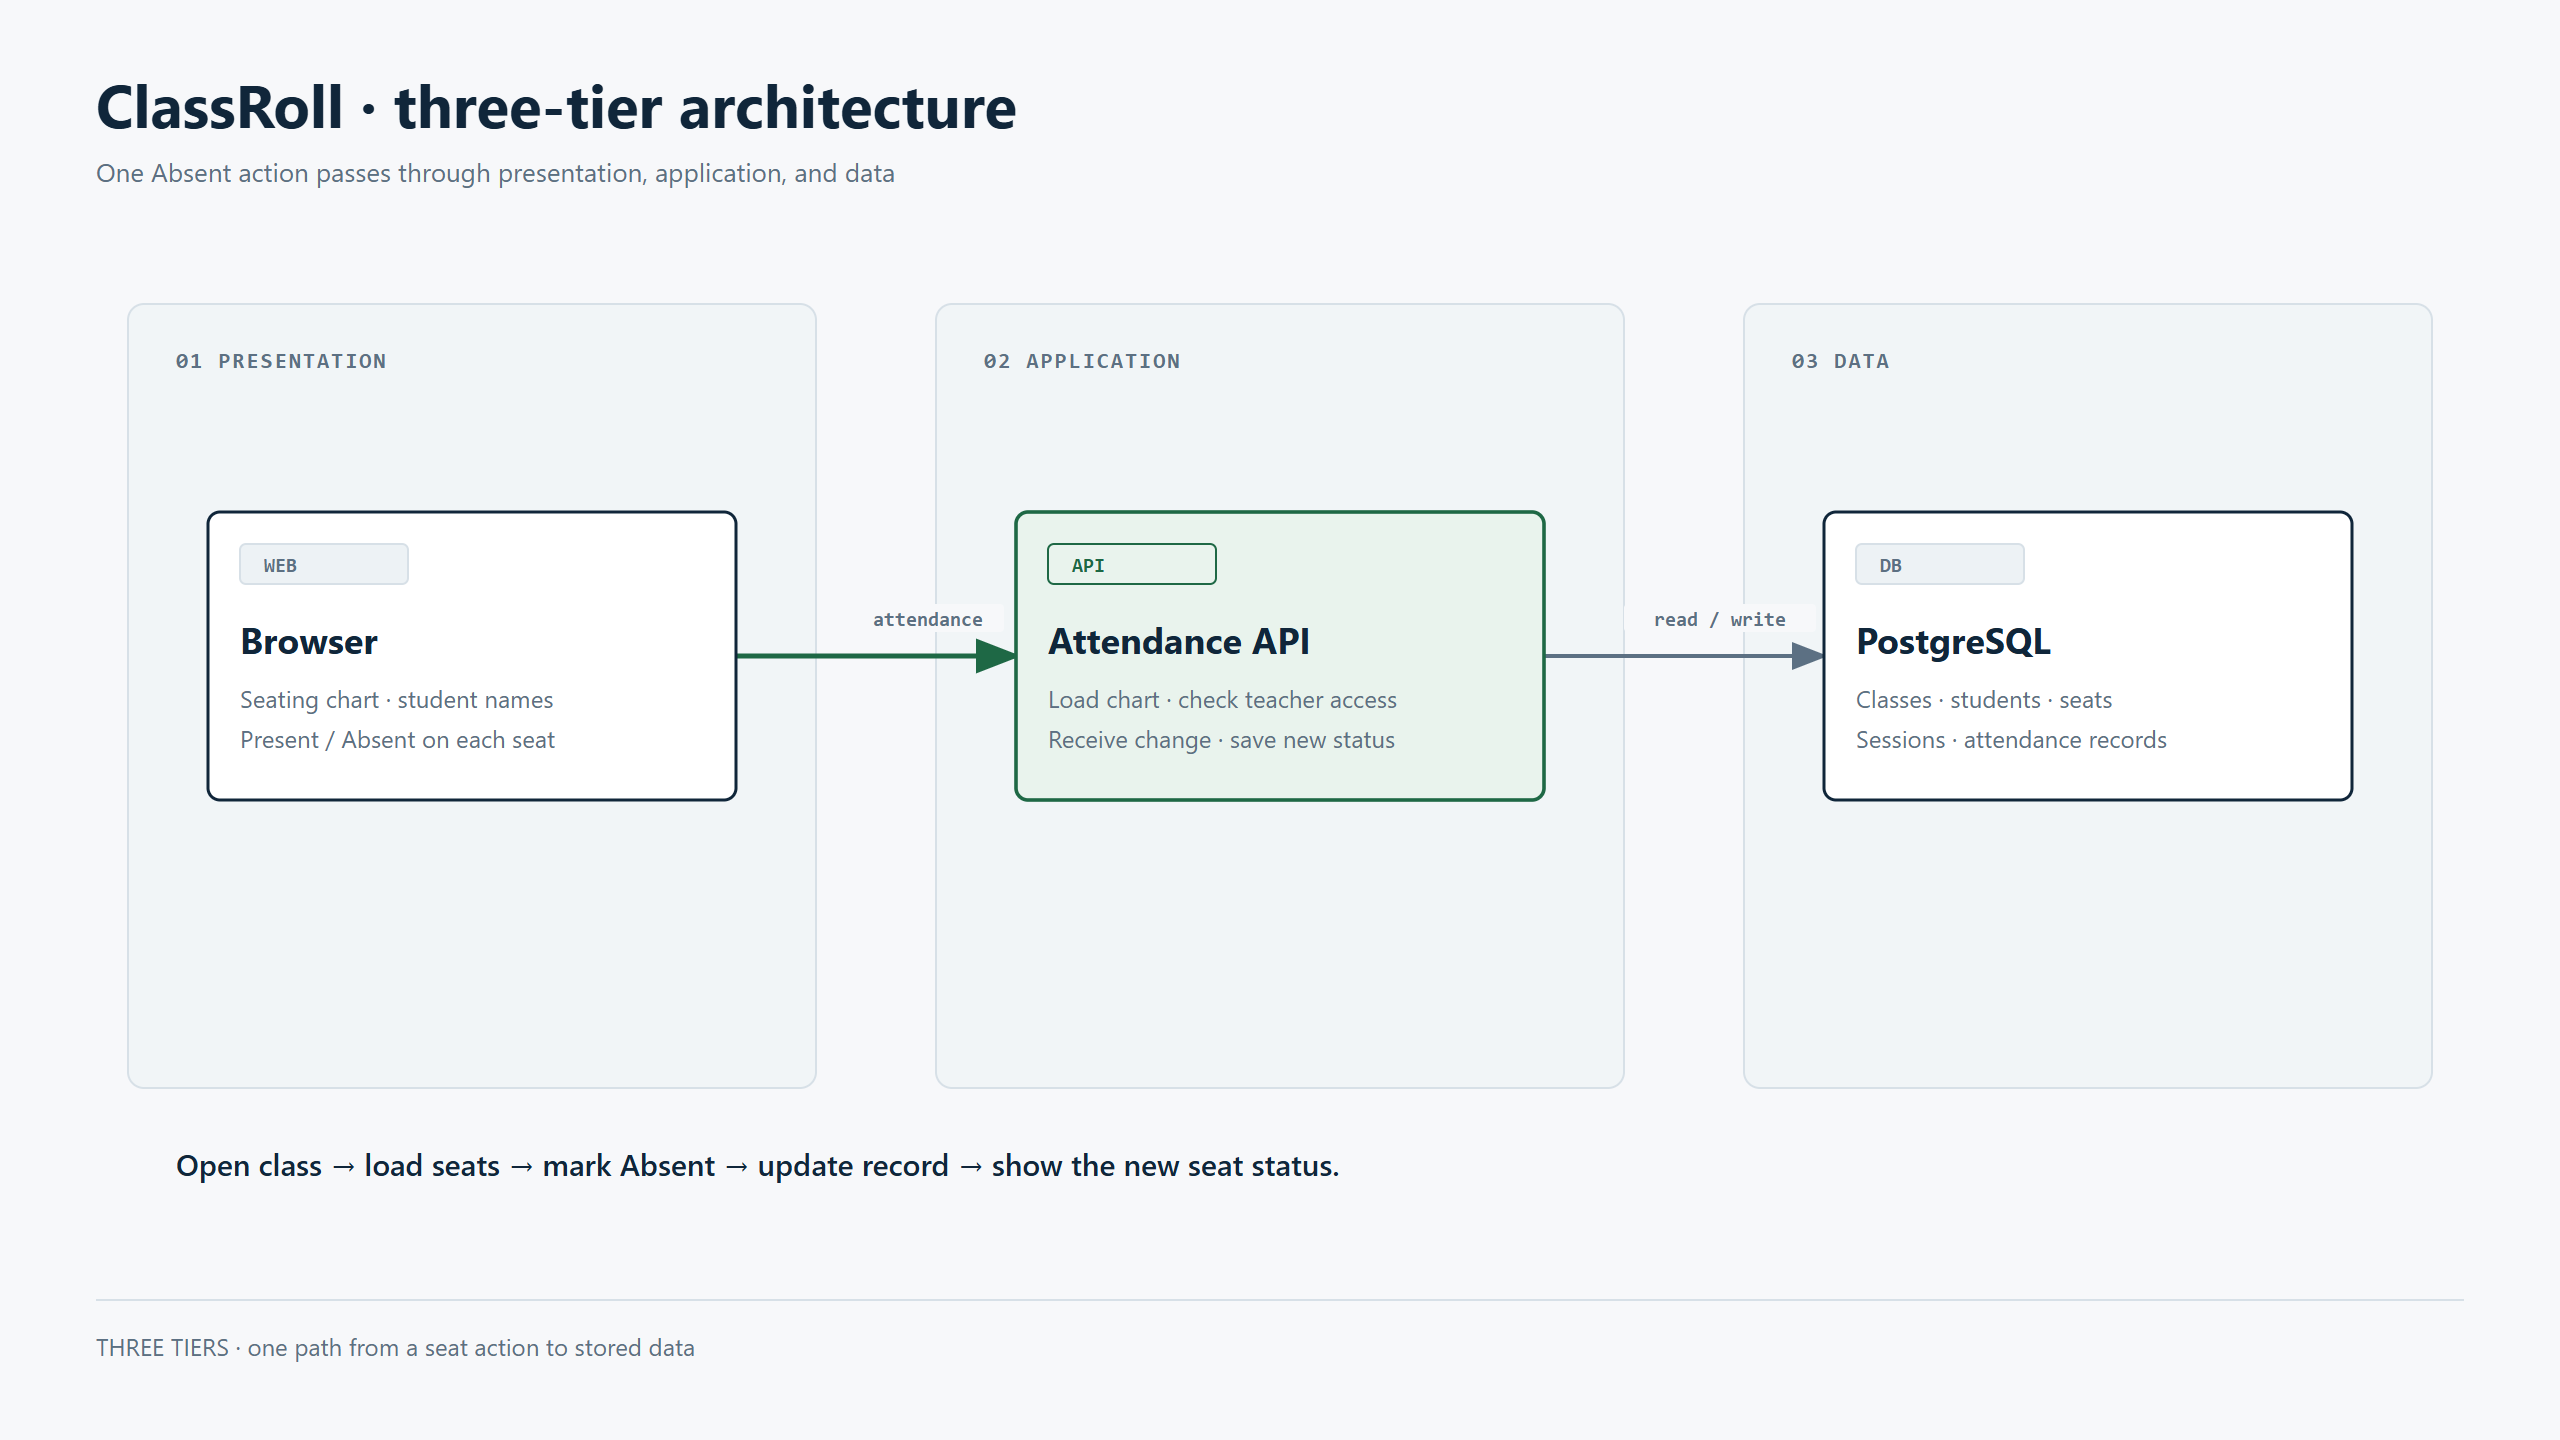
The UML component diagram shows how the class picker, seating chart, API components, and data store depend on one another. The three-tier view reduces this to Browser → Attendance API → PostgreSQL. I use the component view to discuss the boundaries between parts; the three-tier view explains the main path of an attendance change.
One attendance action
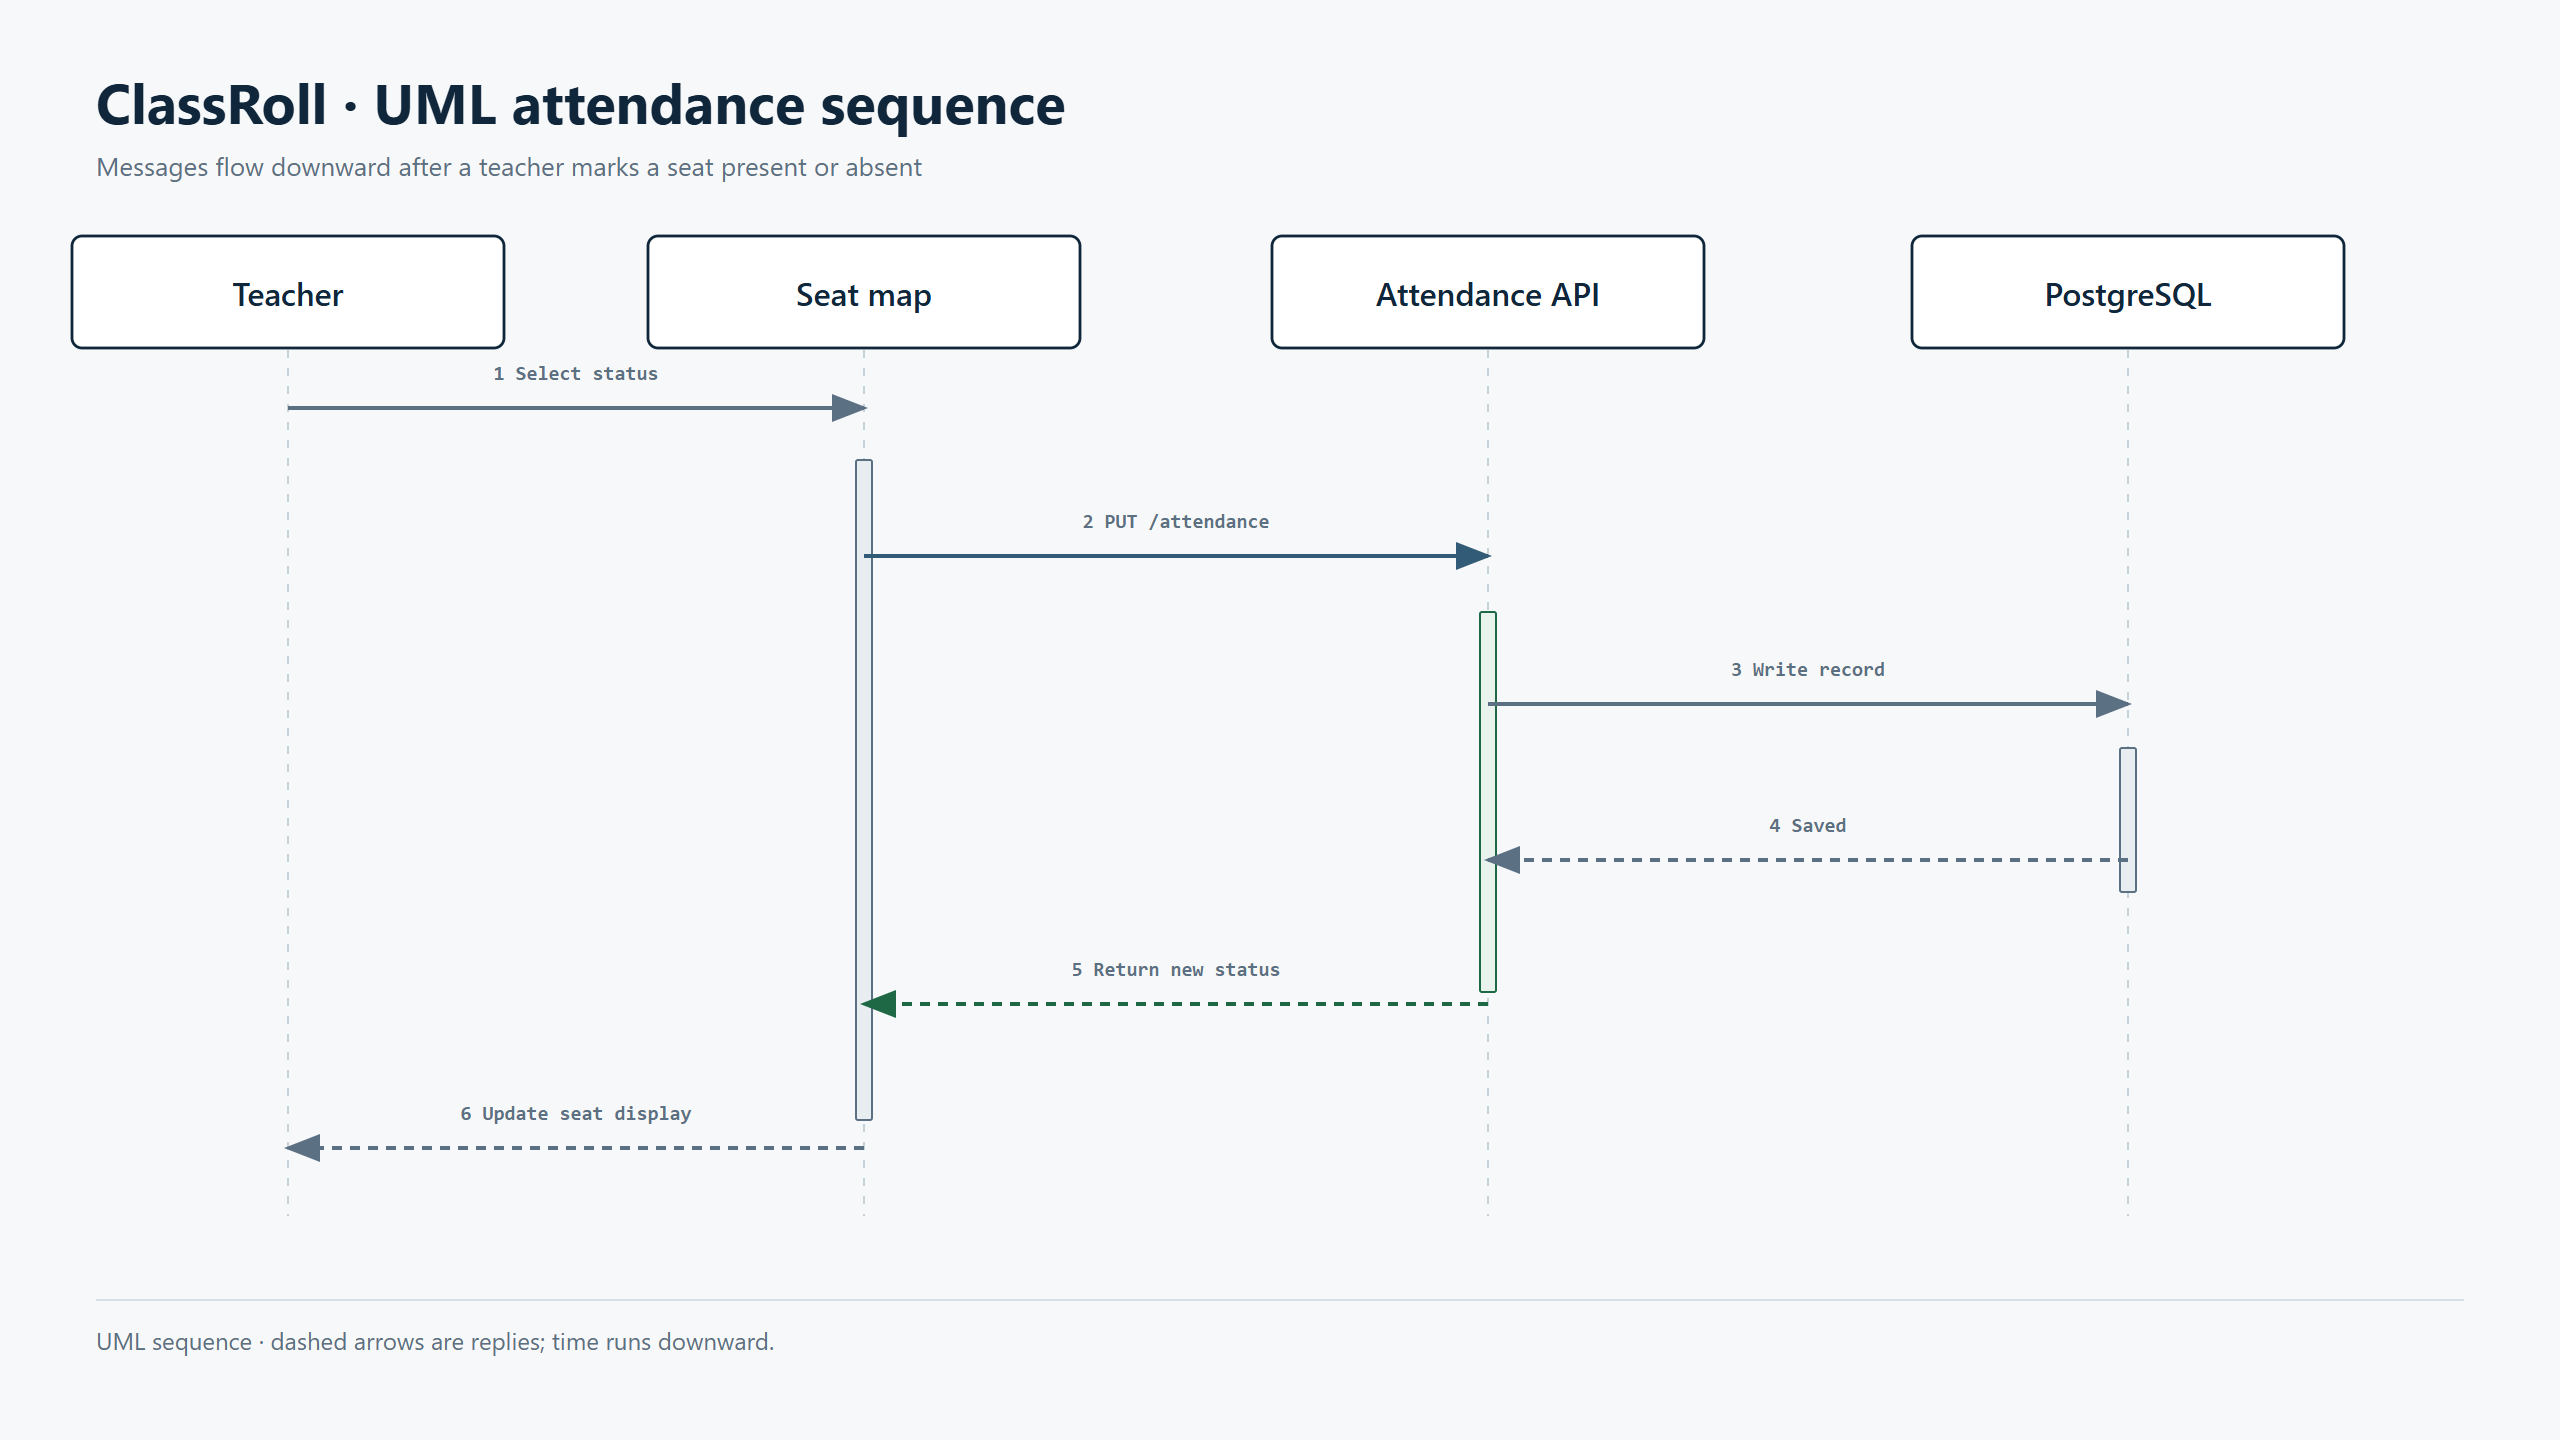
When the teacher clicks Absent, the sequence diagram puts the messages in time order: the UI calls the API, the API saves the record, and the new status returns to the seat on screen. The flowchart follows the teacher's action: choose a class, choose a seat, check whether it has a student, then save the status. An empty seat leads back to seat selection.
Classes and stored data
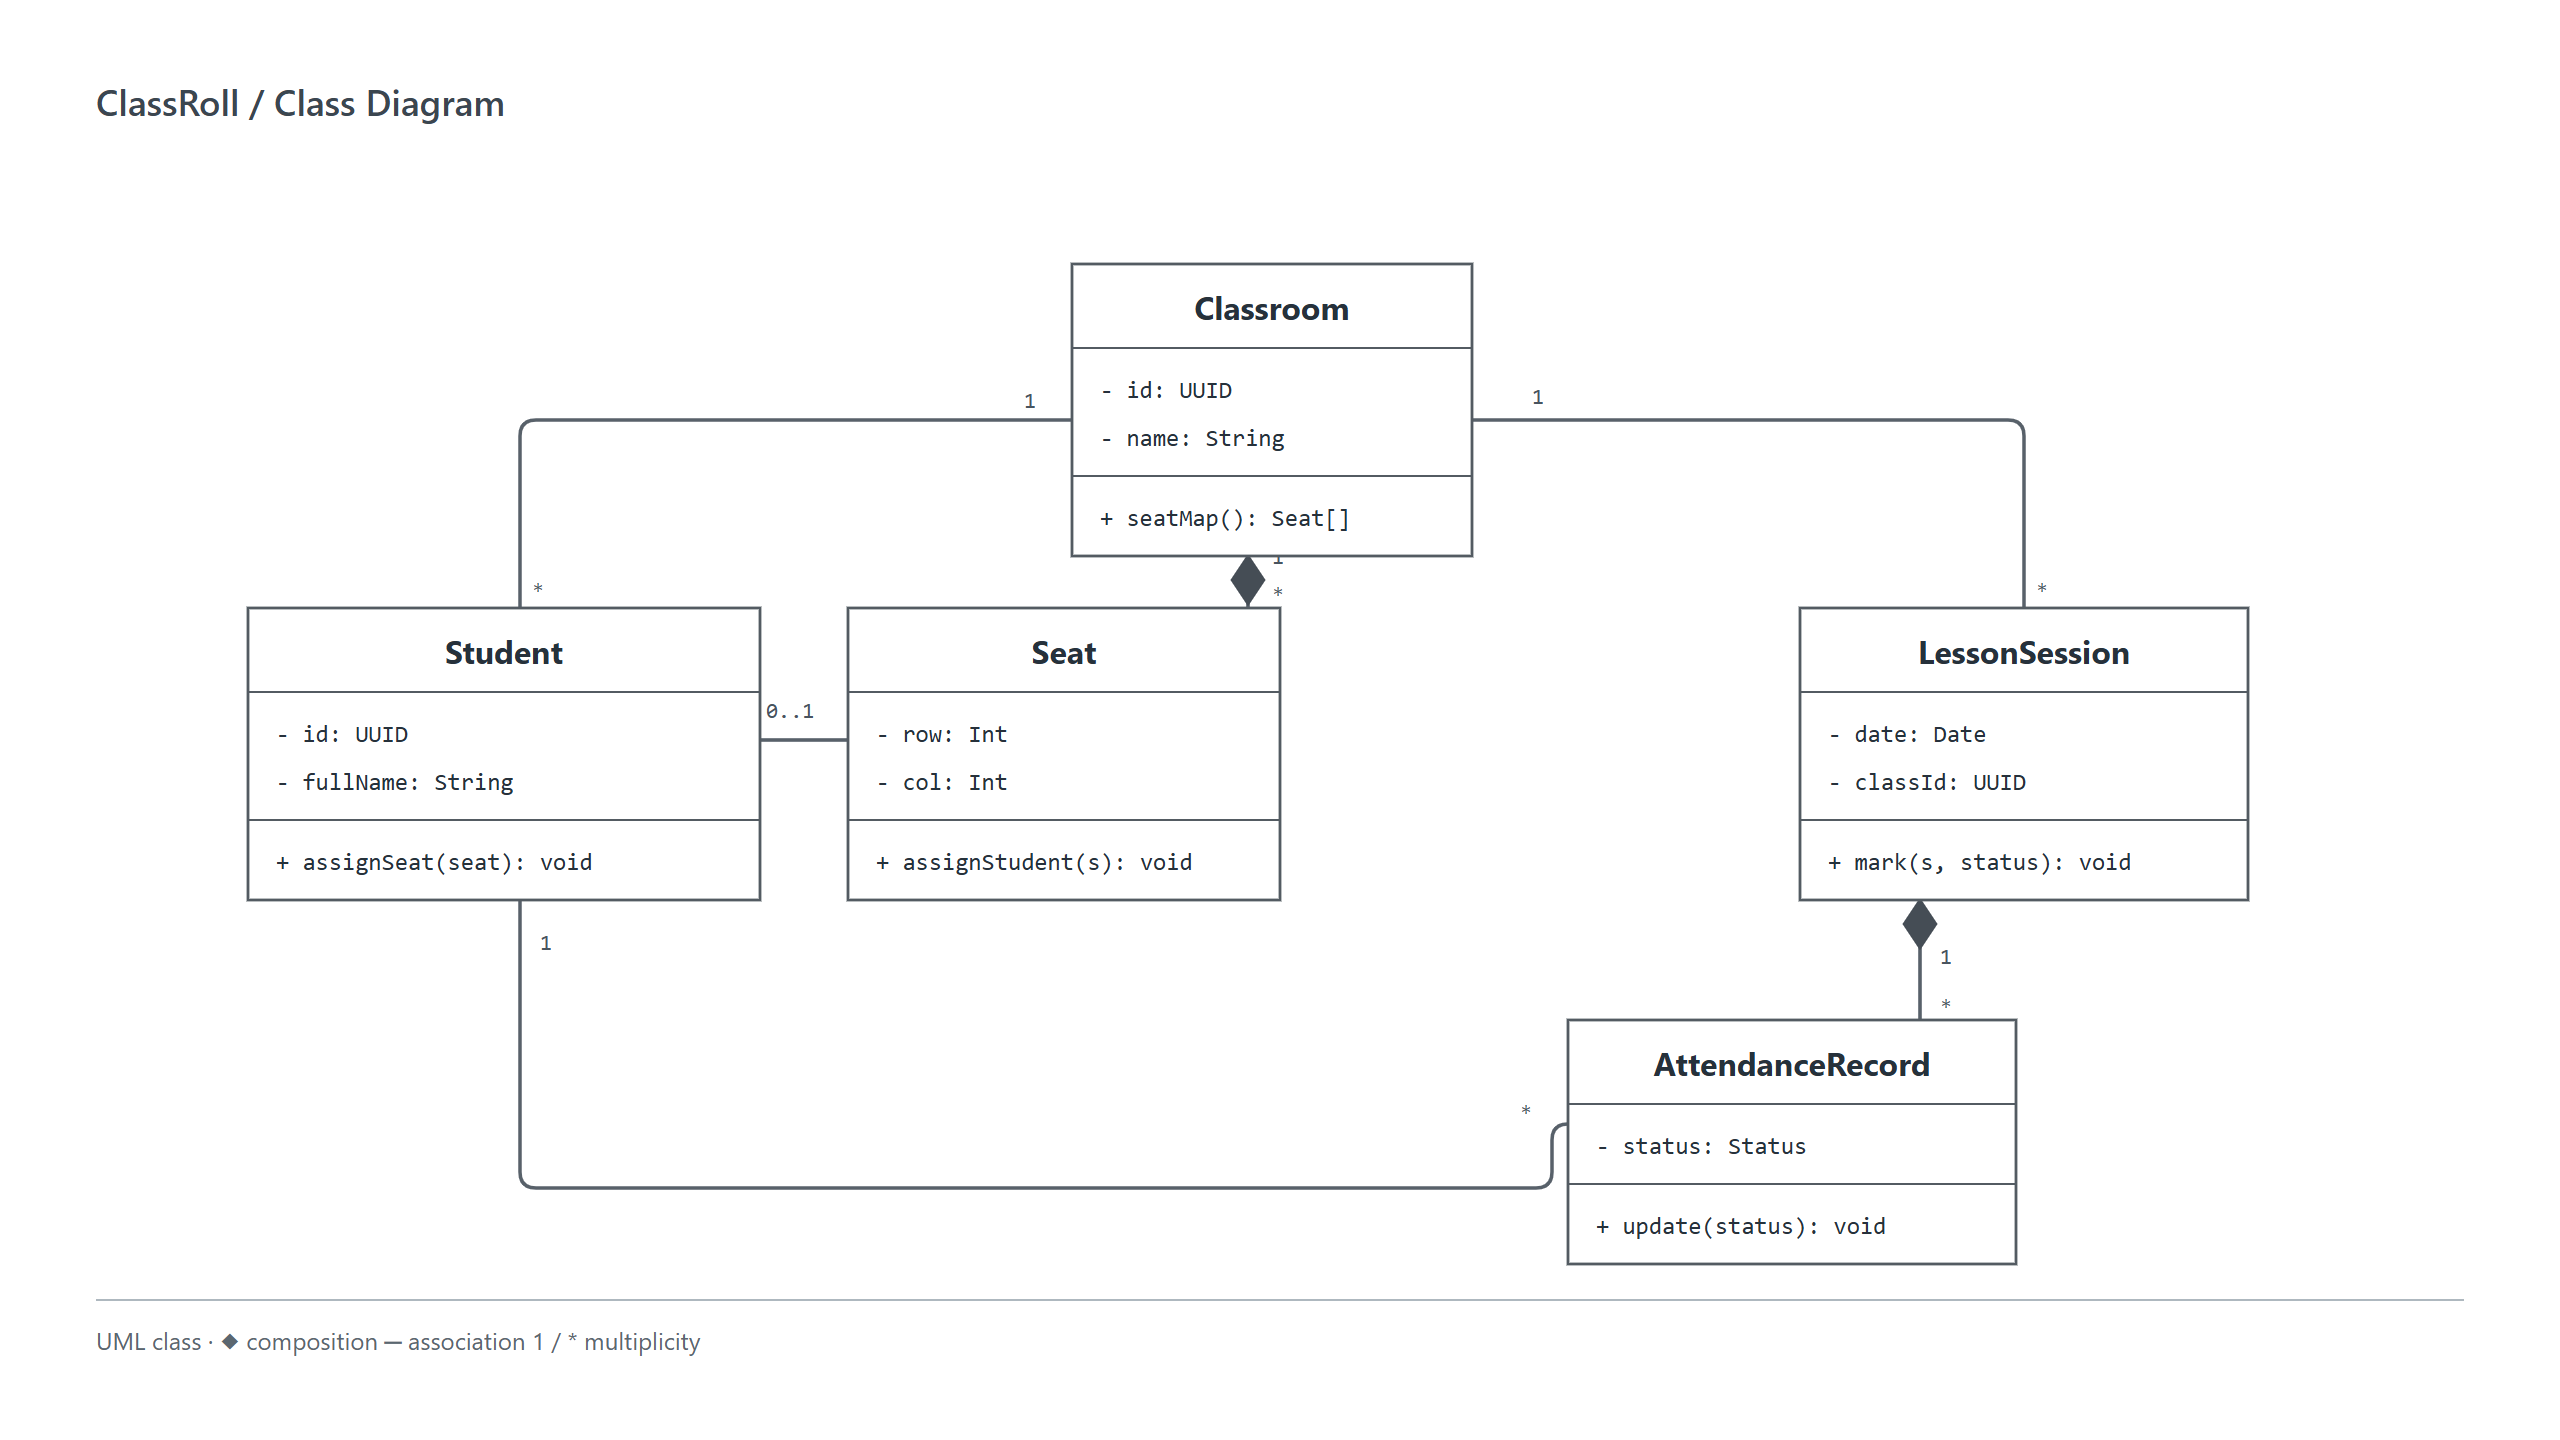
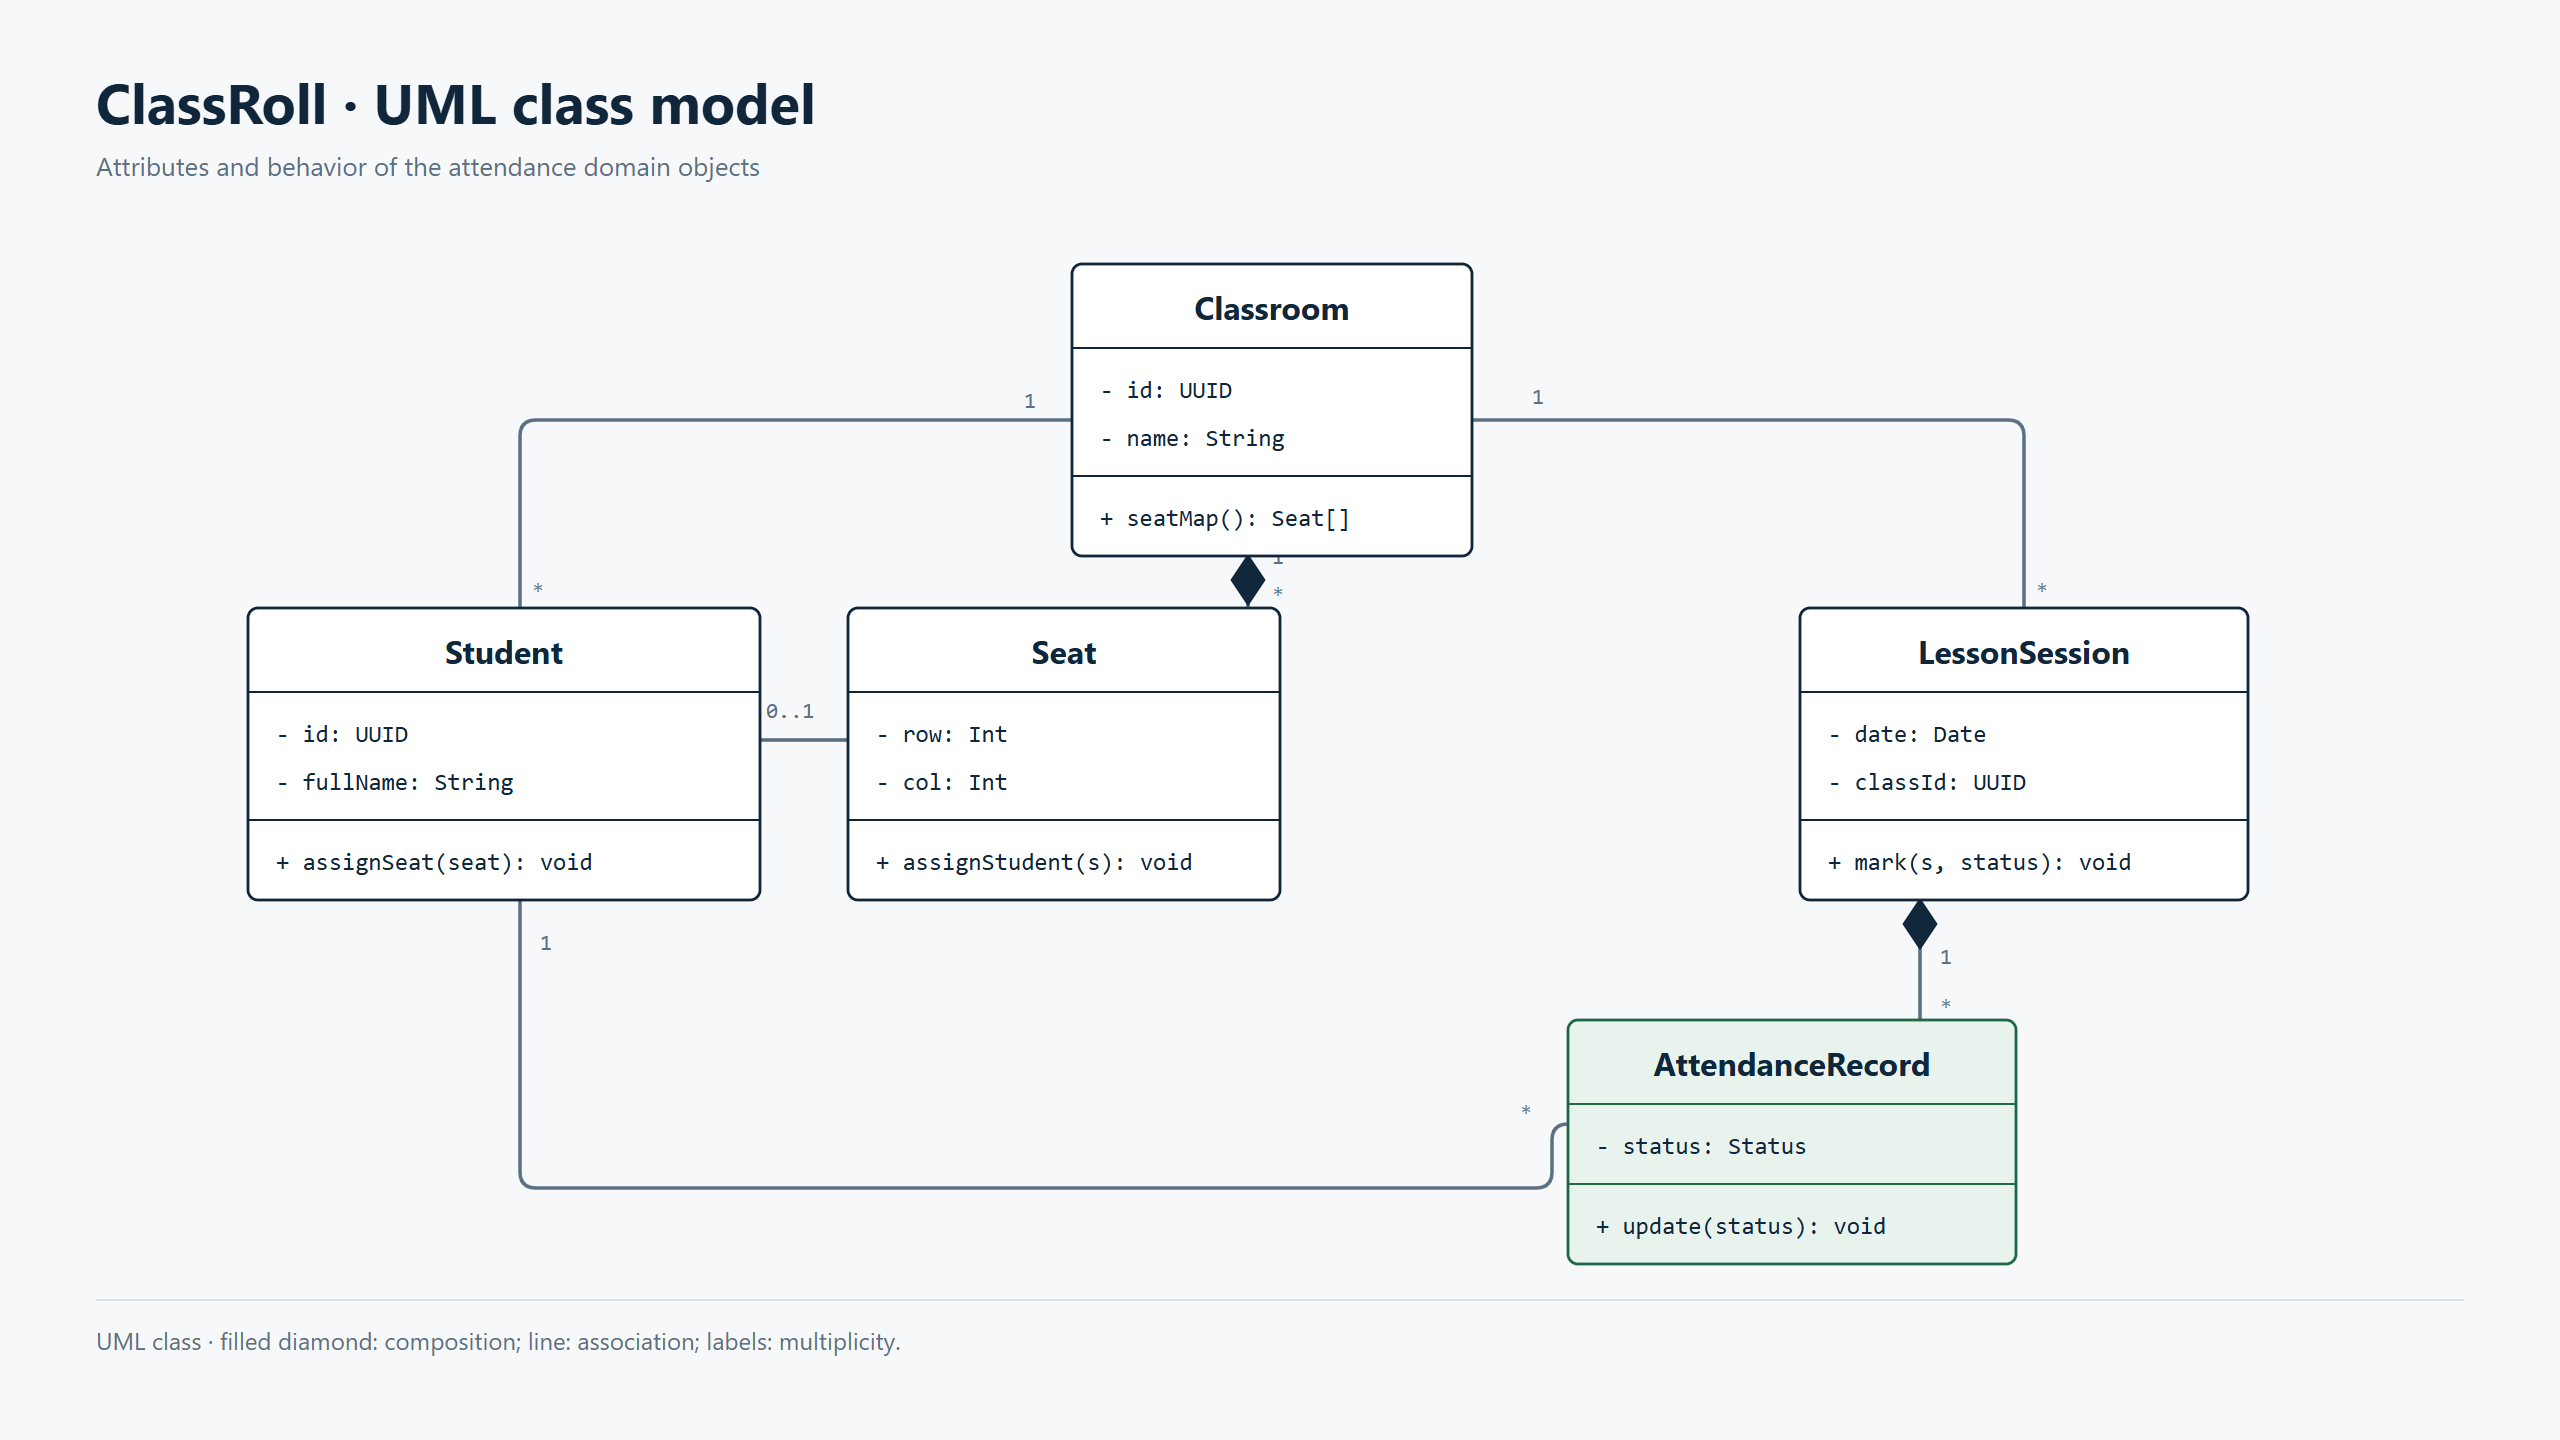
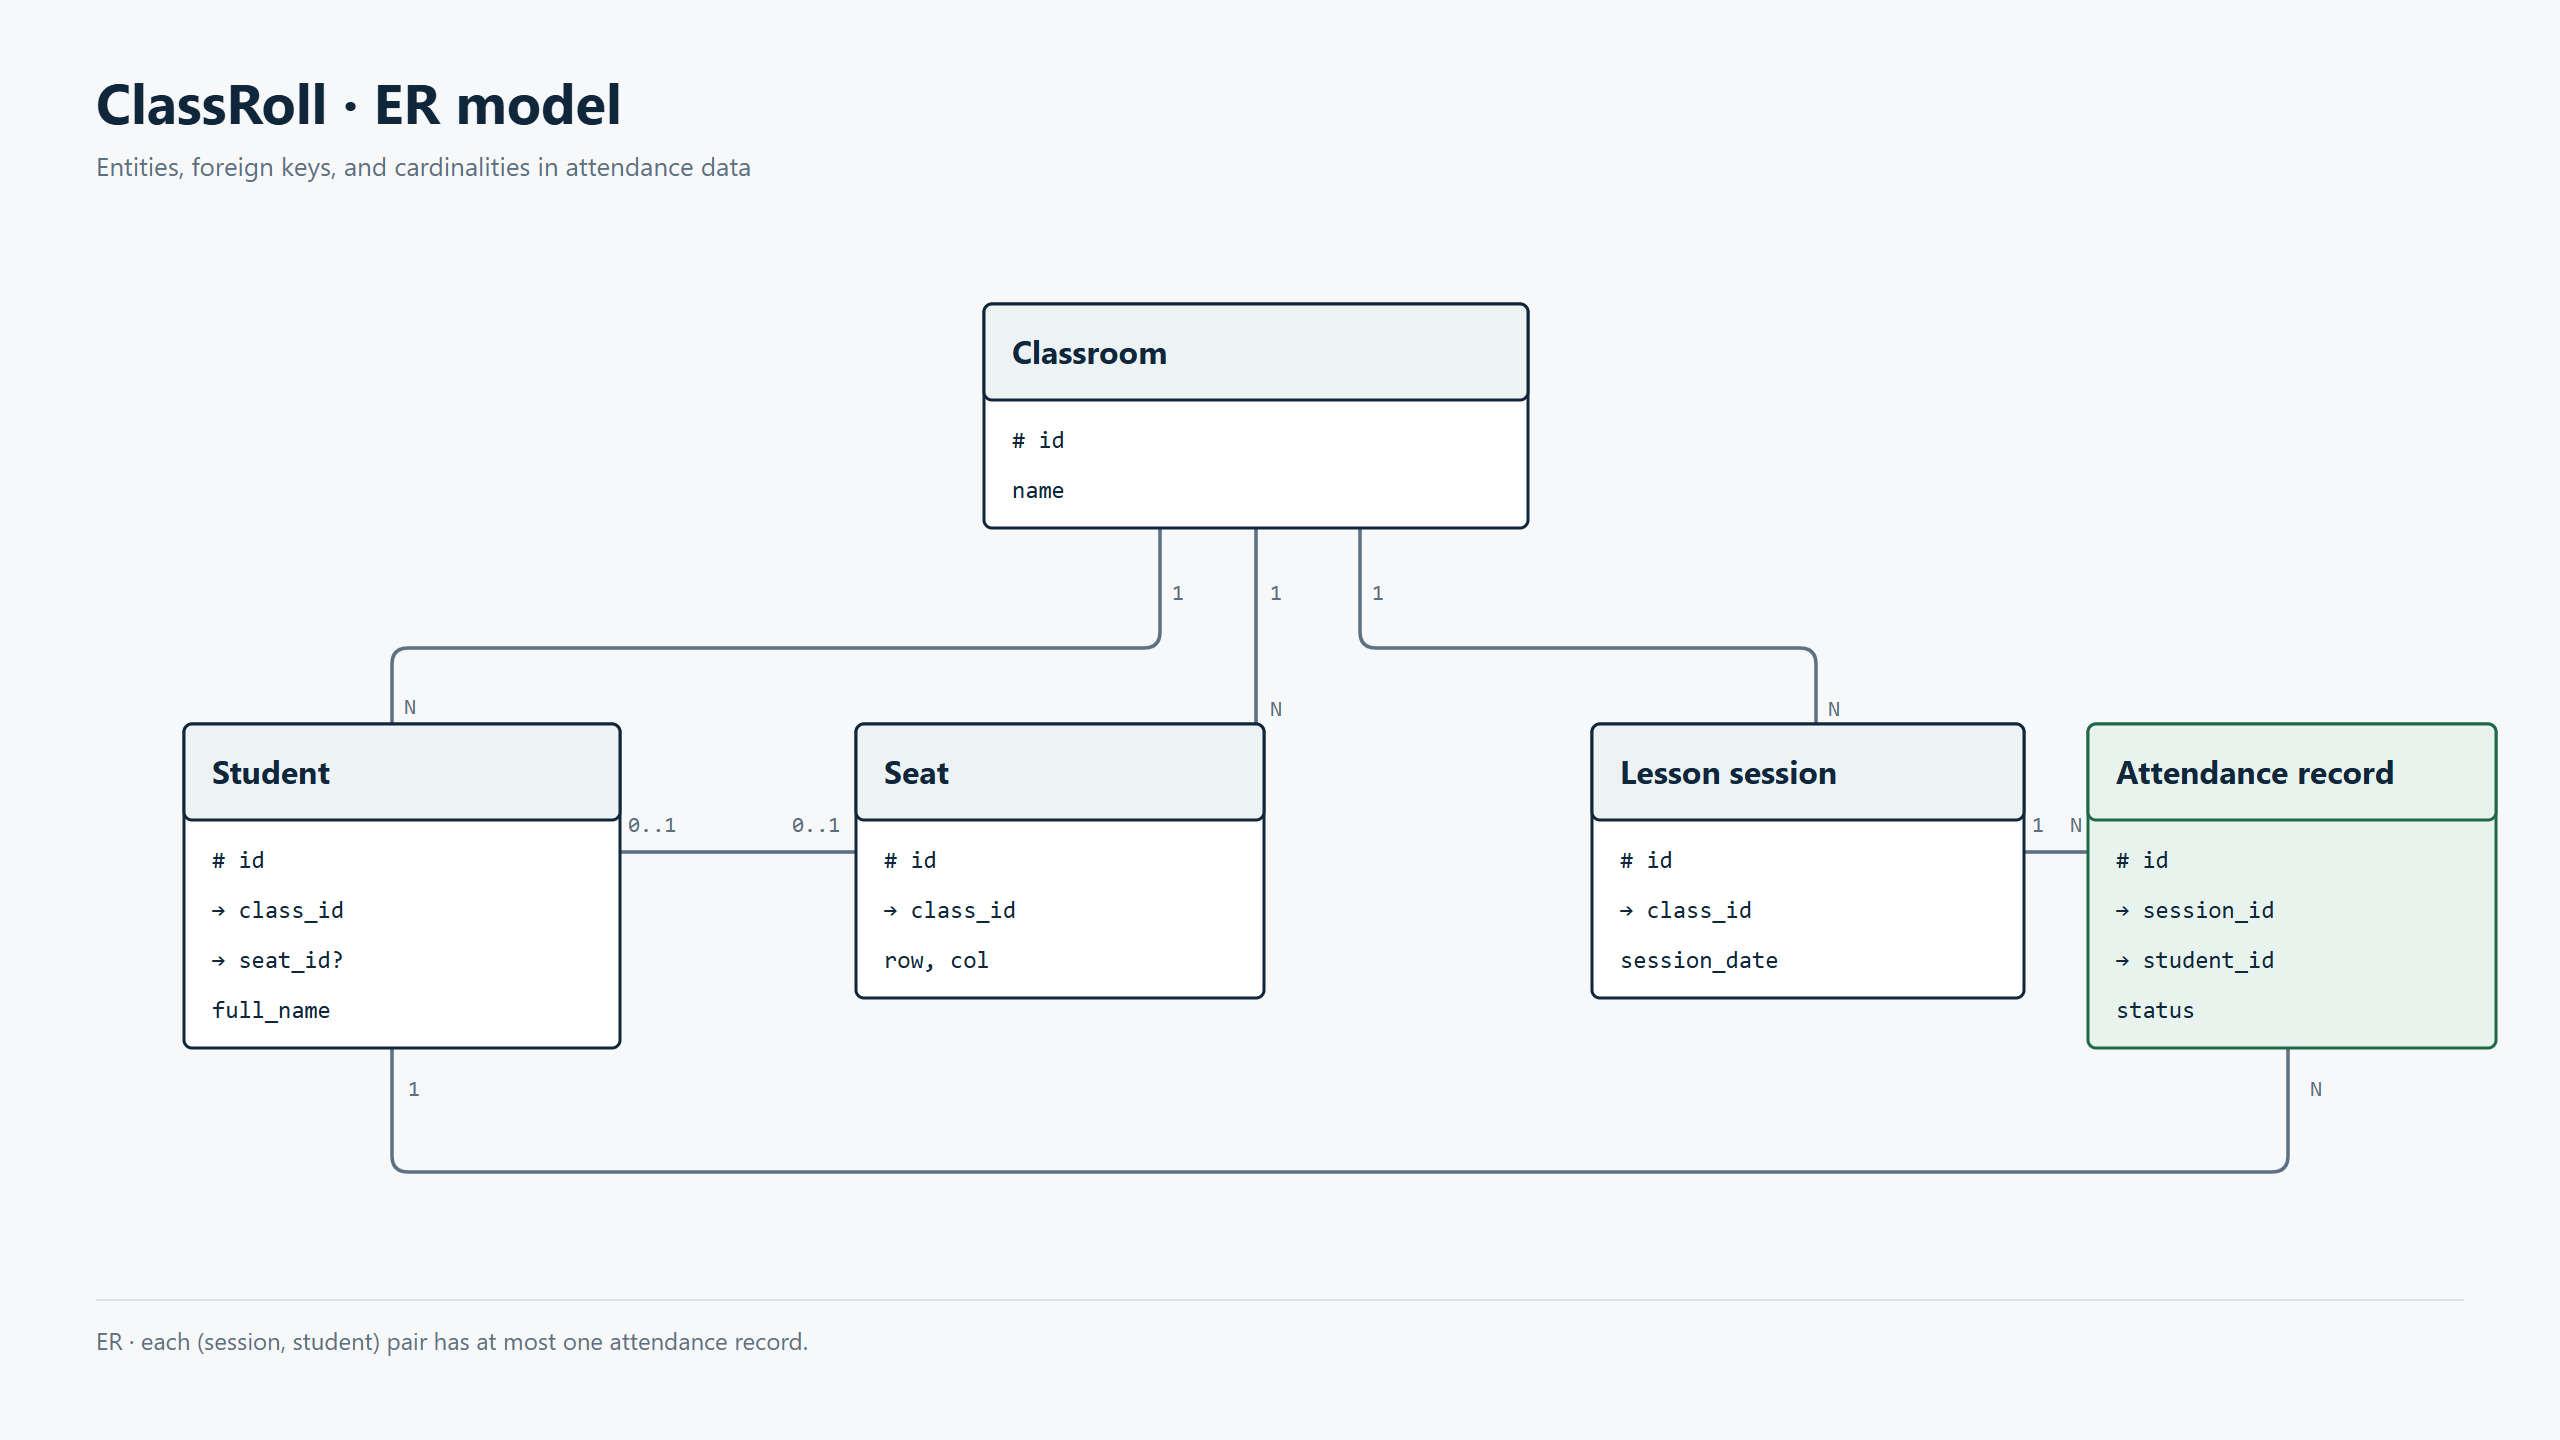
The UML class diagram lists attributes, operations, and relationships among Classroom, Student, Seat, LessonSession, and AttendanceRecord. For example, LessonSession has a mark(s, status) operation and contains its attendance records. The ER diagram shows the foreign keys: which class owns a student or seat, and which lesson session and student a record belongs to. I would use the two images in different parts of the same design discussion.
From a Markdown specification to an HTML diagram
In addition, if you want to get more out of the skill, we can create extension skills that use .md specification files to produce our designs. I will make an example with the following flow.
Suppose we want to create a diagram of a three-tier architecture:
I wrote classroll-three-tier.md:
# ClassRoll — three-tier architecture diagram

## Three tiers

1. **Presentation:** The browser displays the seating chart,
   student names, and attendance status.
2. **Application:** Attendance API loads the chart, receives changes,
   checks the teacher's access, and saves the new status.
3. **Data:** PostgreSQL stores classes, students, seats,
   lesson sessions, and attendance records.

## One action

Teacher opens a class → browser calls Attendance API →
API reads seats and statuses from PostgreSQL →
teacher marks one seat Absent → API updates the record →
browser shows the new status on that seat.

## Diagram requirements

- One three-tier diagram in English, read from left to right.
- Keep only Browser, Attendance API, and PostgreSQL.
- Export standalone HTML with inline CSS and SVG; no server.
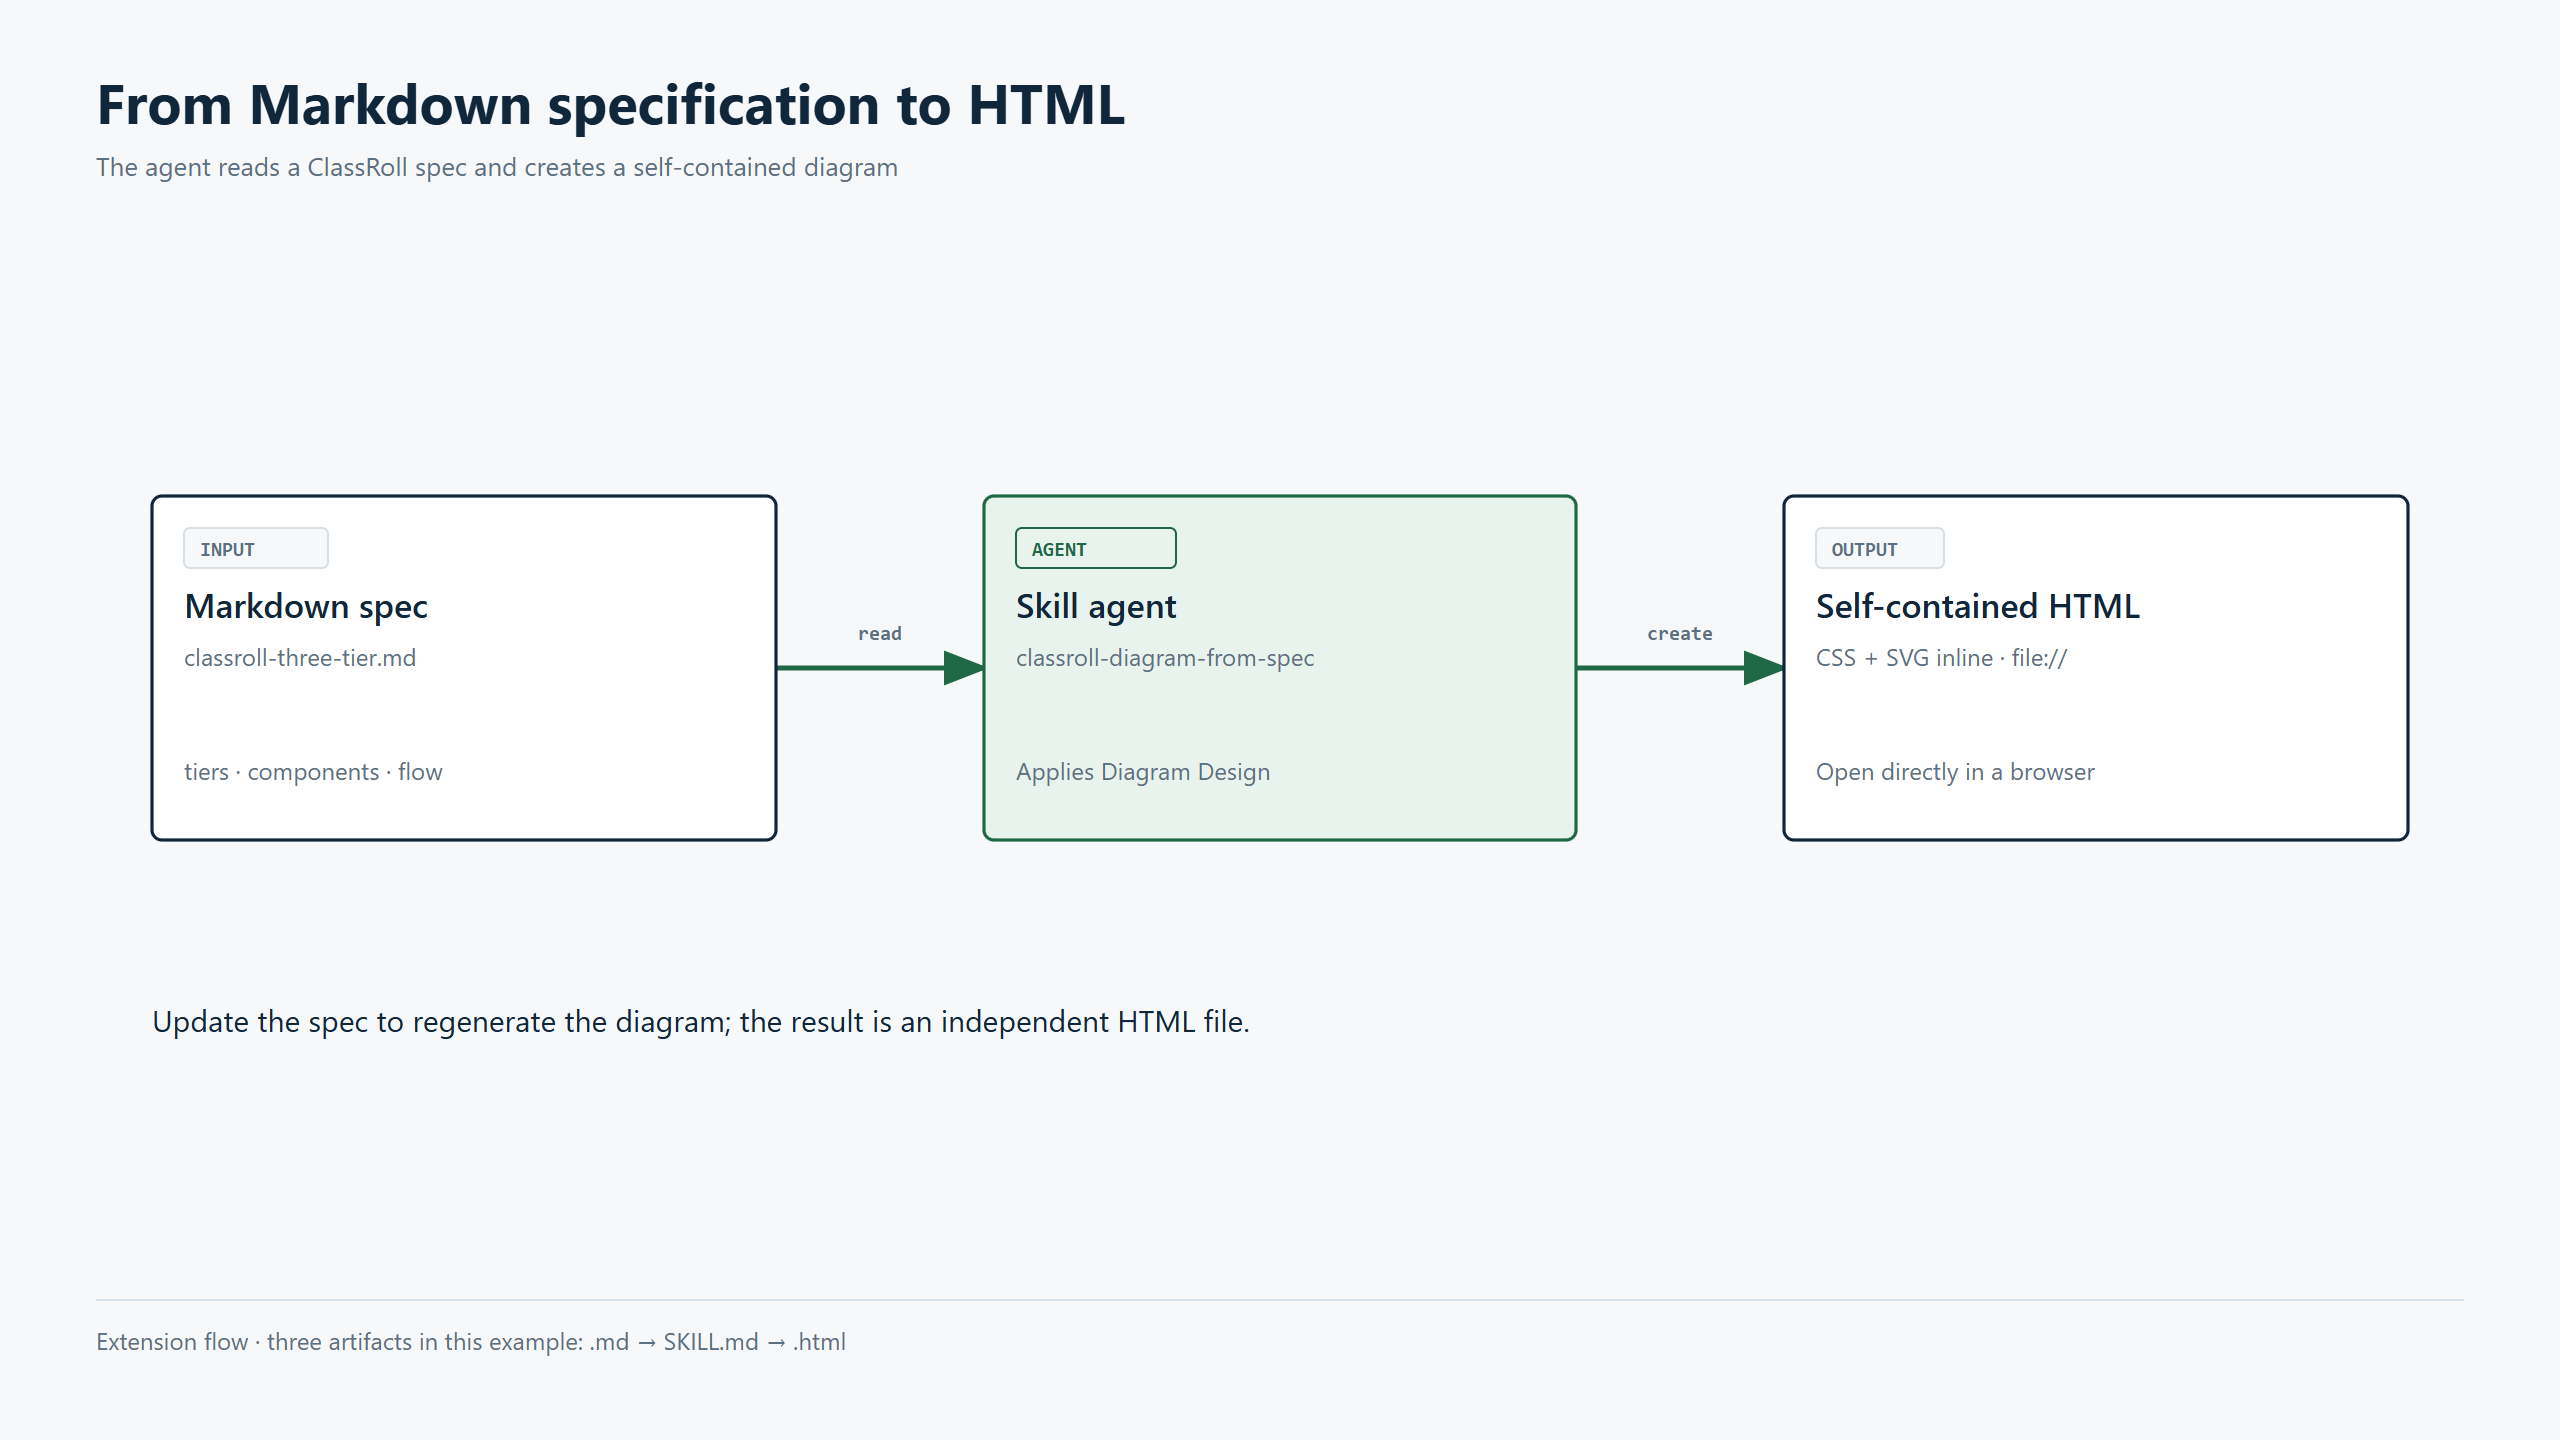
The classroll-diagram-from-spec skill reads the specification, applies Diagram Design's architecture type, and writes self-contained HTML. Here is the short version of its SKILL.md instructions:
Read the supplied .md file before drawing. Use only components,
relationships, labels, and constraints present in the file.

Apply Diagram Design's architecture type to the three-tier example.

Create the requested .html file directly. Put all styling and SVG
markup inline so it opens with file:// and requires no server.
I drew that workflow with Diagram Design as well:
Then I ran it, and here are the results:
I continued the Codex chat with this request:
Read
classroll-three-tier.mdandclassroll-diagram-from-spec/SKILL.md. Use Diagram Design to create a self-contained HTML file for the three-tier diagram directly, then export a PNG. Do not create a diagram generator script.
The result keeps its CSS and SVG inside one file. I captured the resulting diagram below.
Conclusion
Diagram Design helped me move from one problem to several diagram types quickly. For ClassRoll, the UML views carry the notation I would put in design documentation. The other views make the same system easier to discuss with the team. The Markdown → skill → HTML workflow is useful when the design changes and I need to redraw a figure.
I still had to correct concrete details: the flowchart's empty-seat branch was wrong on the first pass, and some labels needed spacing adjustments.
This skill looks interesting. However, if you think you can just prompt it and put the result straight into your project documentation, be careful. Always review anything generated by AI before using it.
Discussion / Thảo luận
Comments / Bình luận
Chức năng bình luận hiện chưa khả dụng vì tôi vừa chuyển sang nền tảng hosting mới. Nếu bạn muốn trao đổi về bài viết, vui lòng liên hệ contact@jasonnguyenvn.com.
Comments are currently unavailable because I recently moved to a new hosting platform. If you would like to discuss this article, please contact me at contact@jasonnguyenvn.com.